ubx-cfg
Static ESP Testing - Phase 5
Overview
The objective of phase 5 was to see if the dropped frames in phase 4 were due to the ESP32 @ 80 MHz. The SYRAC GPS devices were configured to use GPS + Galileo + BeiDou B1C @ 5 Hz, ESP32 @ 160 MHz, and max sats = 20, 24, 28, and 32.
The tests were started on 2026-07-11 @ 2345 and the duration was just under 9 hours. The results showed max sats = 28 to be optimal @ 5 Hz, and that the ESP32 needs to be clocked at 160 MHz. 5 Hz still looking likely to be much better than 10 Hz.
The D models were also observed to perform noticeably better than the S models. The results and conclusions of all previous have been reviewed to see if they may have been affected, but fortunately they were not.
Configurations
The following device configurations were tested.
| ID | Constellations | Rate | Max Sats | ESP | Observed time distribution (ms) | Drops? |
|---|---|---|---|---|---|---|
| SY1 | GPS + Galileo + BeiDou B1C | 5 Hz | 24 | 160 MHz | 199: 3, 200: 157518, 201: 3 | - |
| S3 | GPS + Galileo + BeiDou B1C | 5 Hz | 32 | 160 MHz | - | - |
| D1 | GPS + Galileo + BeiDou B1C | 5 Hz | 28 | 160 MHz | 199: 10, 200: 156753, 201: 10 | - |
| D2 | GPS + Galileo + BeiDou B1C | 5 Hz | 24 | 160 MHz | 199: 4, 200: 157173, 201: 4 | - |
| D3 | GPS + Galileo + BeiDou B1C | 5 Hz | 28 | 160 MHz | 199: 16, 200: 157351, 201: 16 | - |
| D5 | GPS + Galileo + BeiDou B1C | 5 Hz | 32 | 160 MHz | 199: 10, 200: 156891, 201: 10 | - |
| SY2 | GPS + Galileo + BeiDou B1C | 5 Hz | 20 | 160 MHz | 199: 32, 200: 156725, 201: 32 | - |
Notes:
- S3 did not record any data during this test, presumably because the “start logging speed” was 1 knot
- None of the devices dropped frames, presumably because ESP32 @ 160 MHz can handle samples @ 5 Hz
Statistics
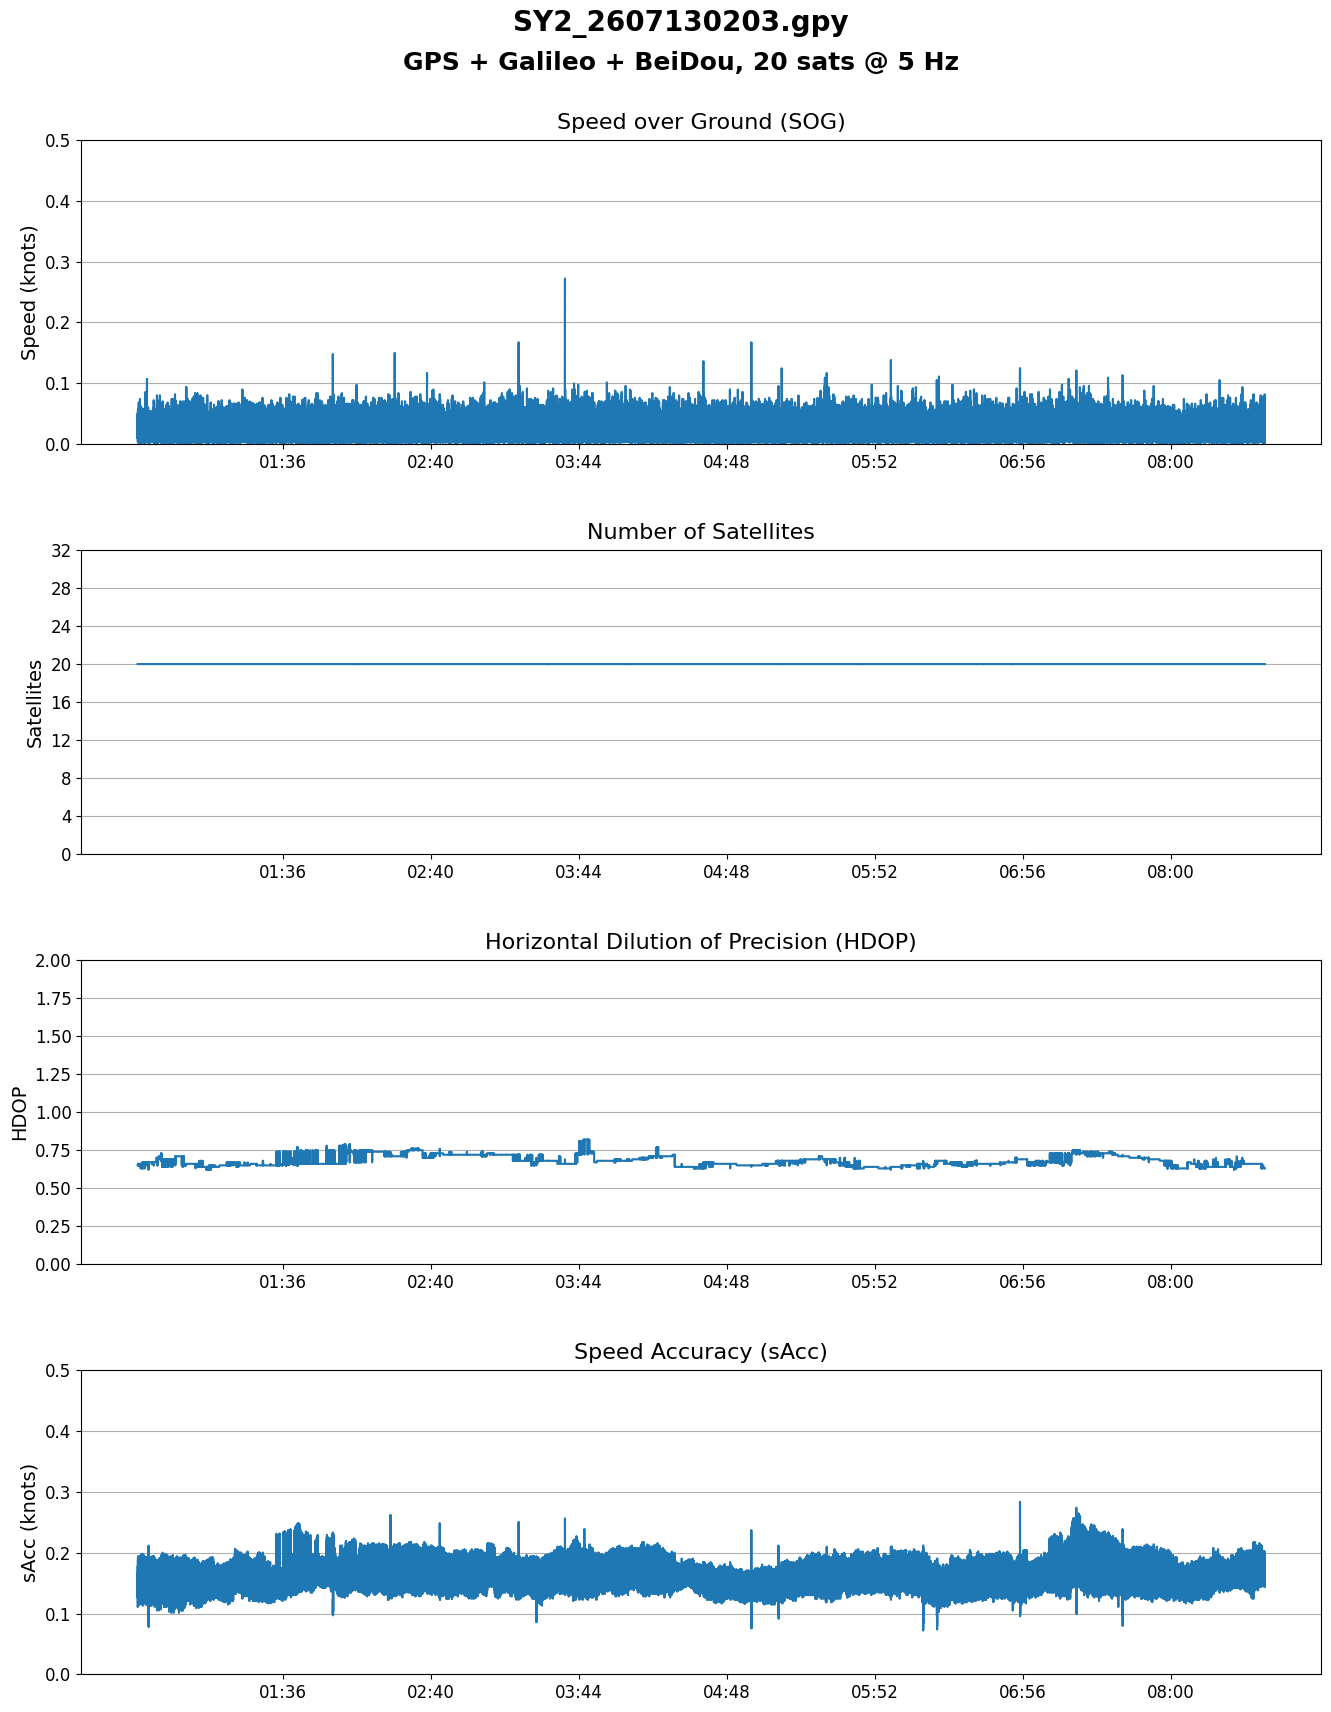
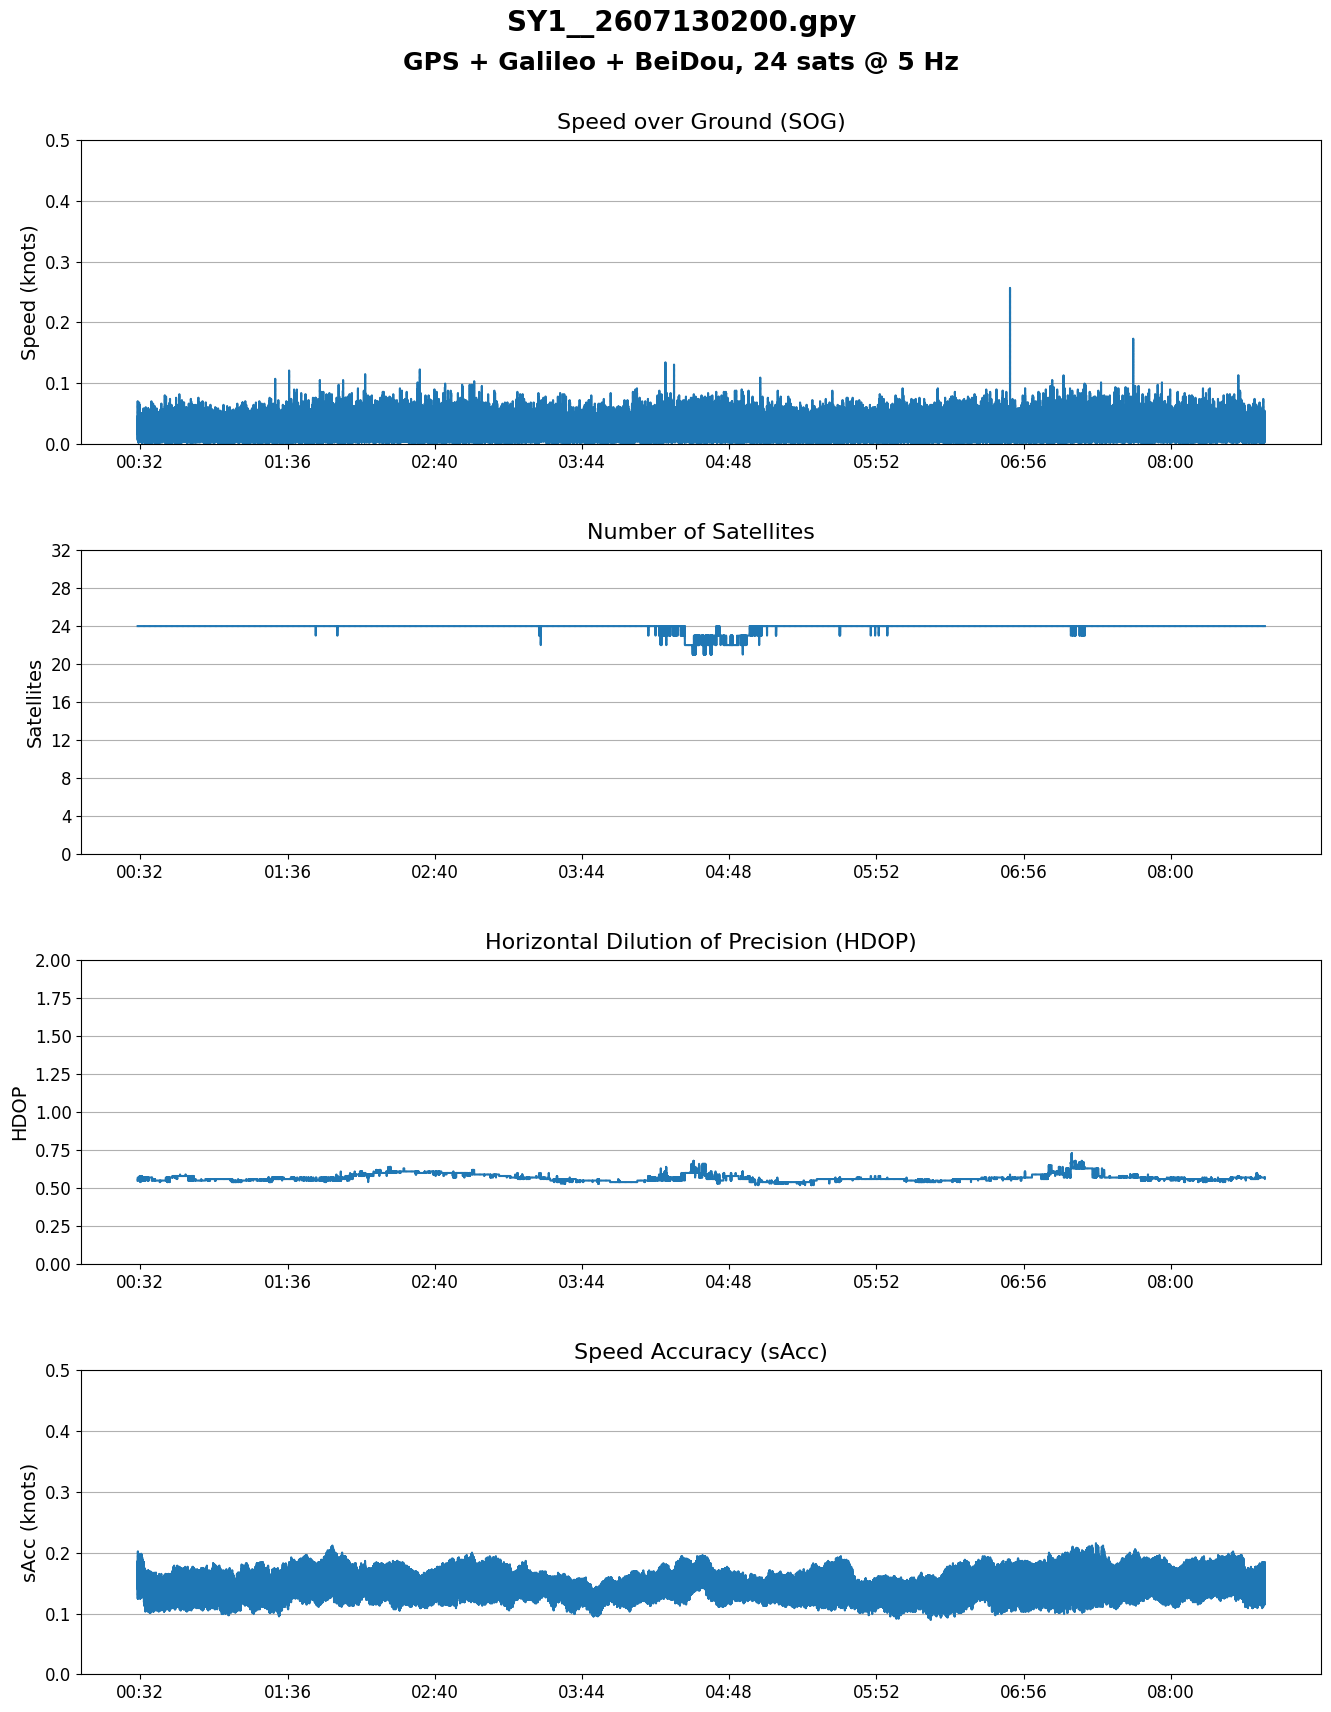
Click the GPY filenames for charts showing SOG, Sats, HDOP, and sAcc.
| File | Configuration | Mean | Median | Stddev |
|---|---|---|---|---|
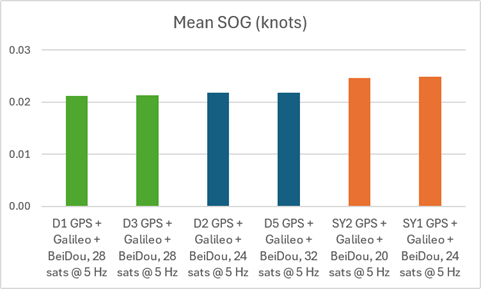
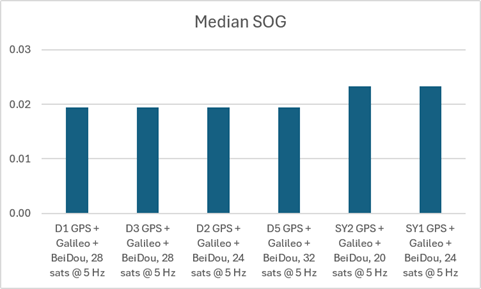
| D1_2607130203.gpy | GPS + Galileo + BeiDou, 28 sats @ 5 Hz | 0.021 | 0.019 | 0.012 |
| D3__2607130201.gpy | GPS + Galileo + BeiDou, 28 sats @ 5 Hz | 0.021 | 0.019 | 0.012 |
| D2__2607130201.gpy | GPS + Galileo + BeiDou, 24 sats @ 5 Hz | 0.022 | 0.019 | 0.012 |
| D5_2607130202.gpy | GPS + Galileo + BeiDou, 32 sats @ 5 Hz | 0.022 | 0.019 | 0.012 |
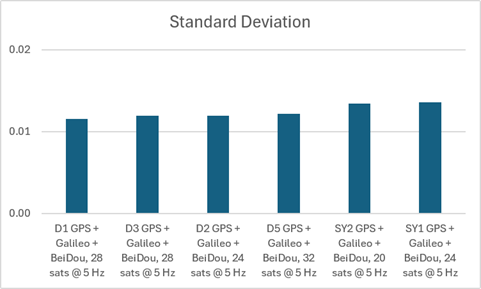
| SY2_2607130203.gpy | GPS + Galileo + BeiDou, 20 sats @ 5 Hz | 0.025 | 0.023 | 0.013 |
| SY1__2607130200.gpy | GPS + Galileo + BeiDou, 24 sats @ 5 Hz | 0.025 | 0.023 | 0.014 |
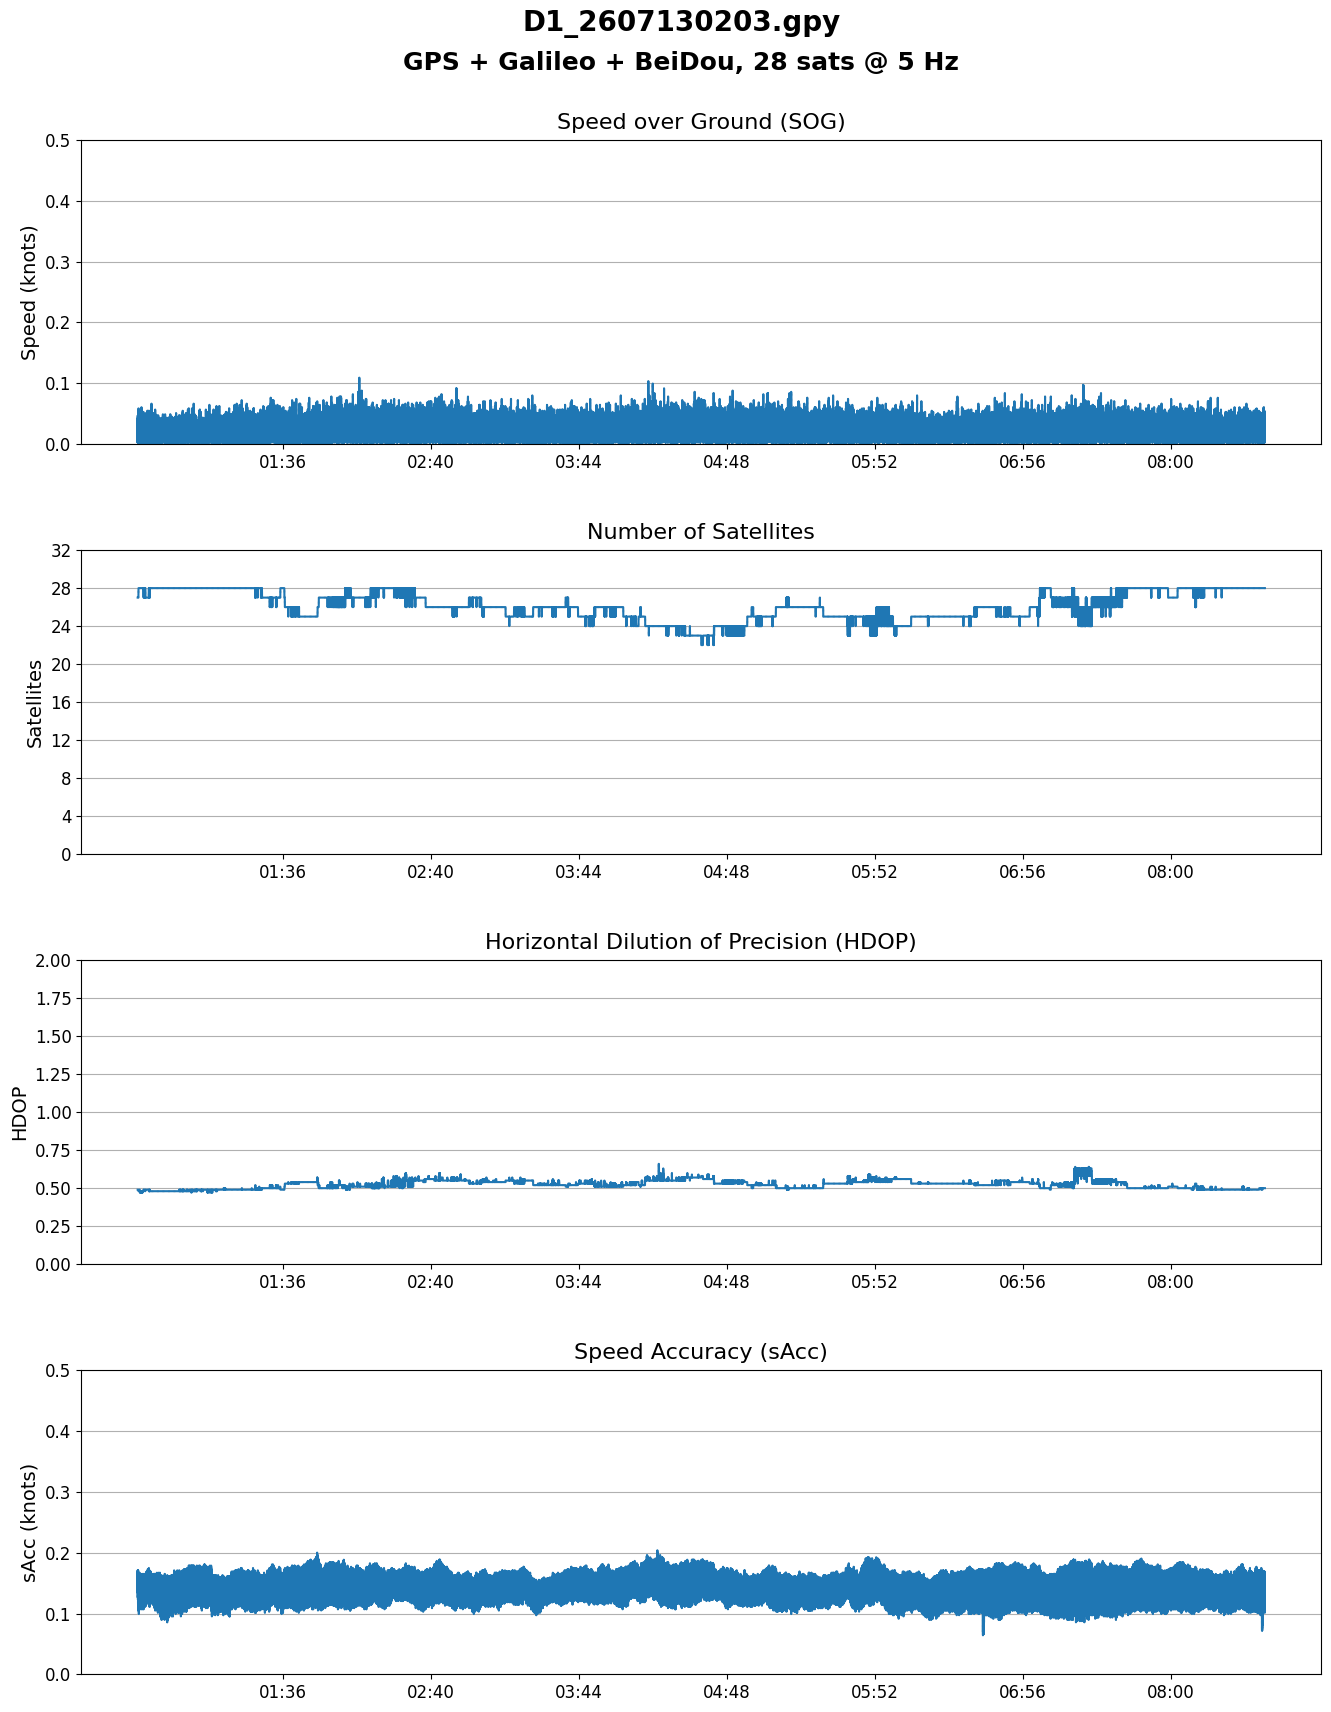
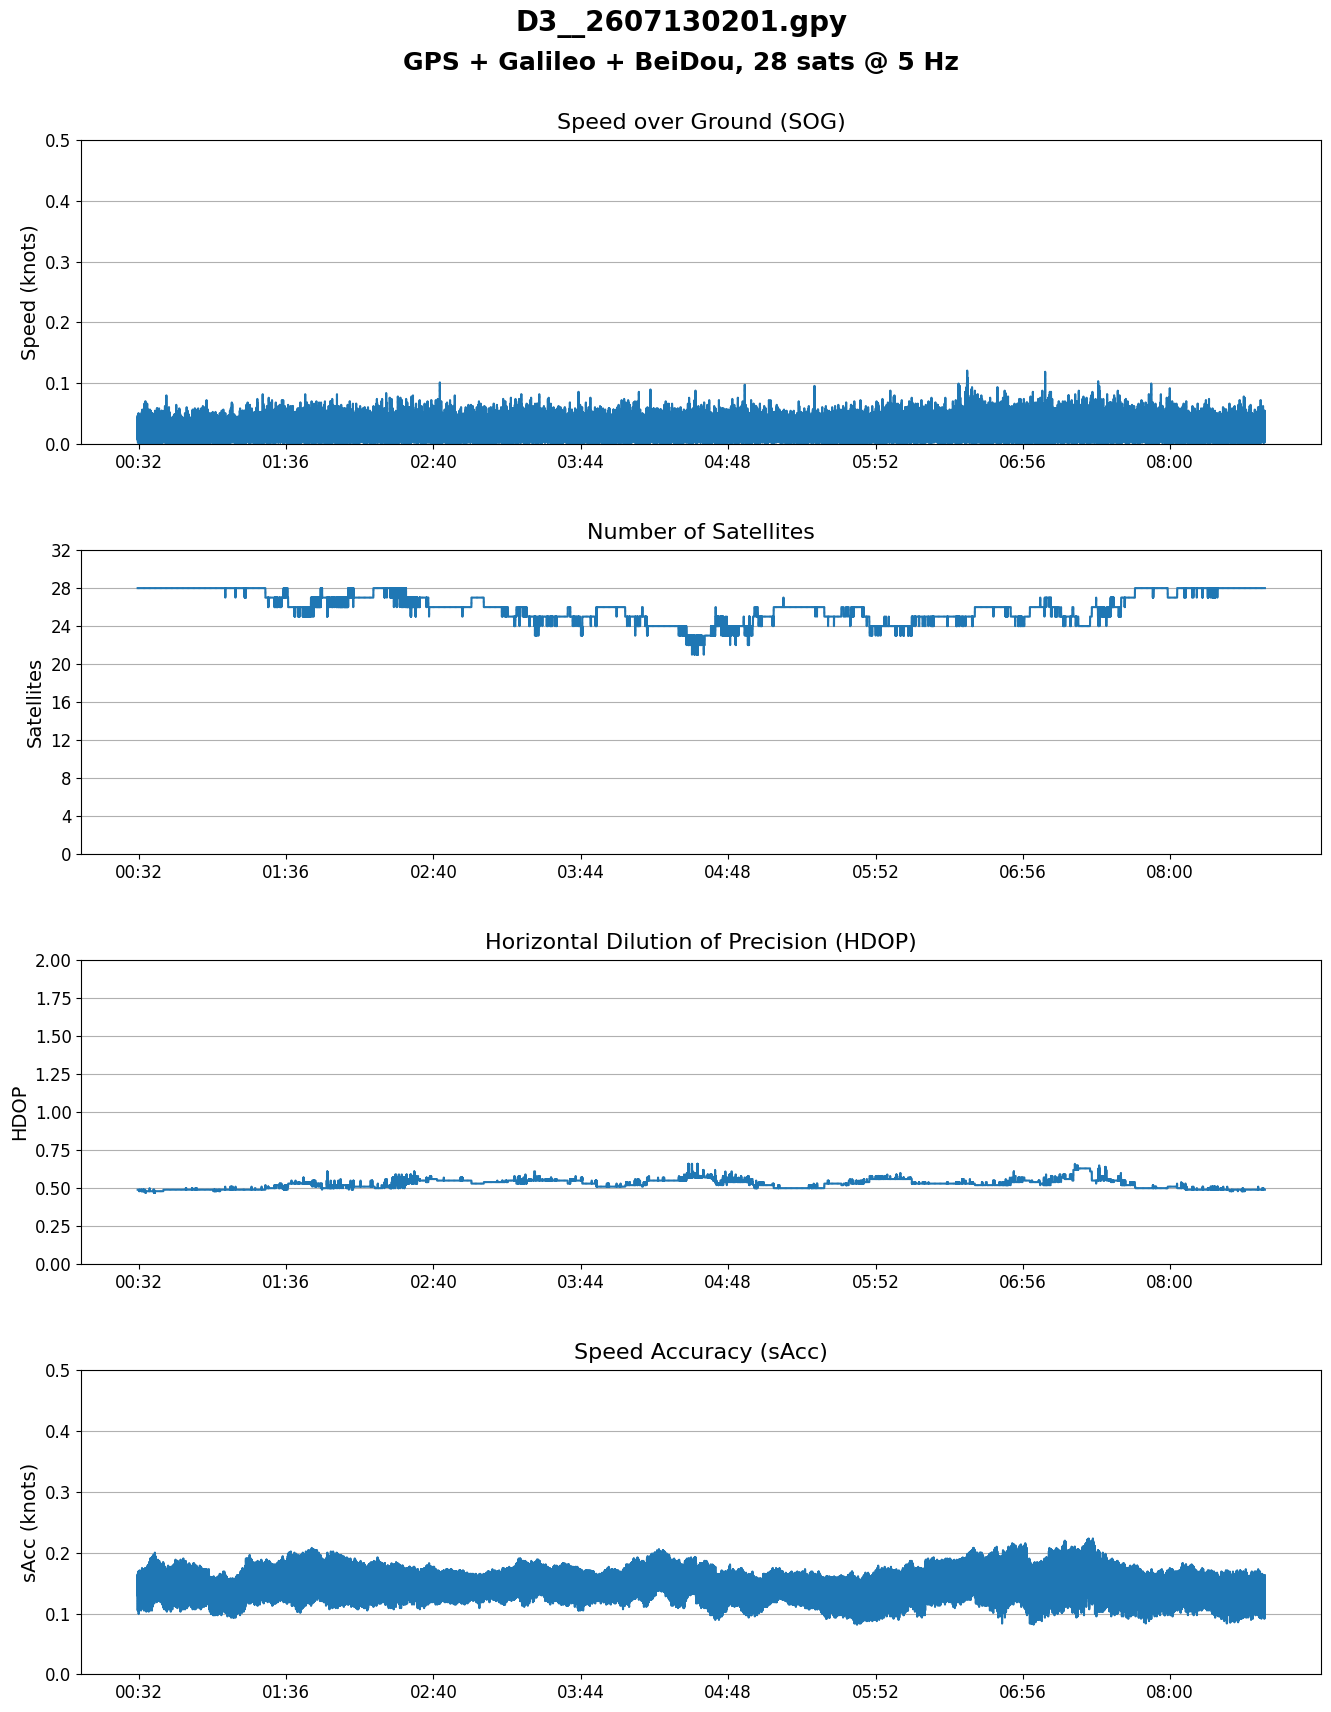
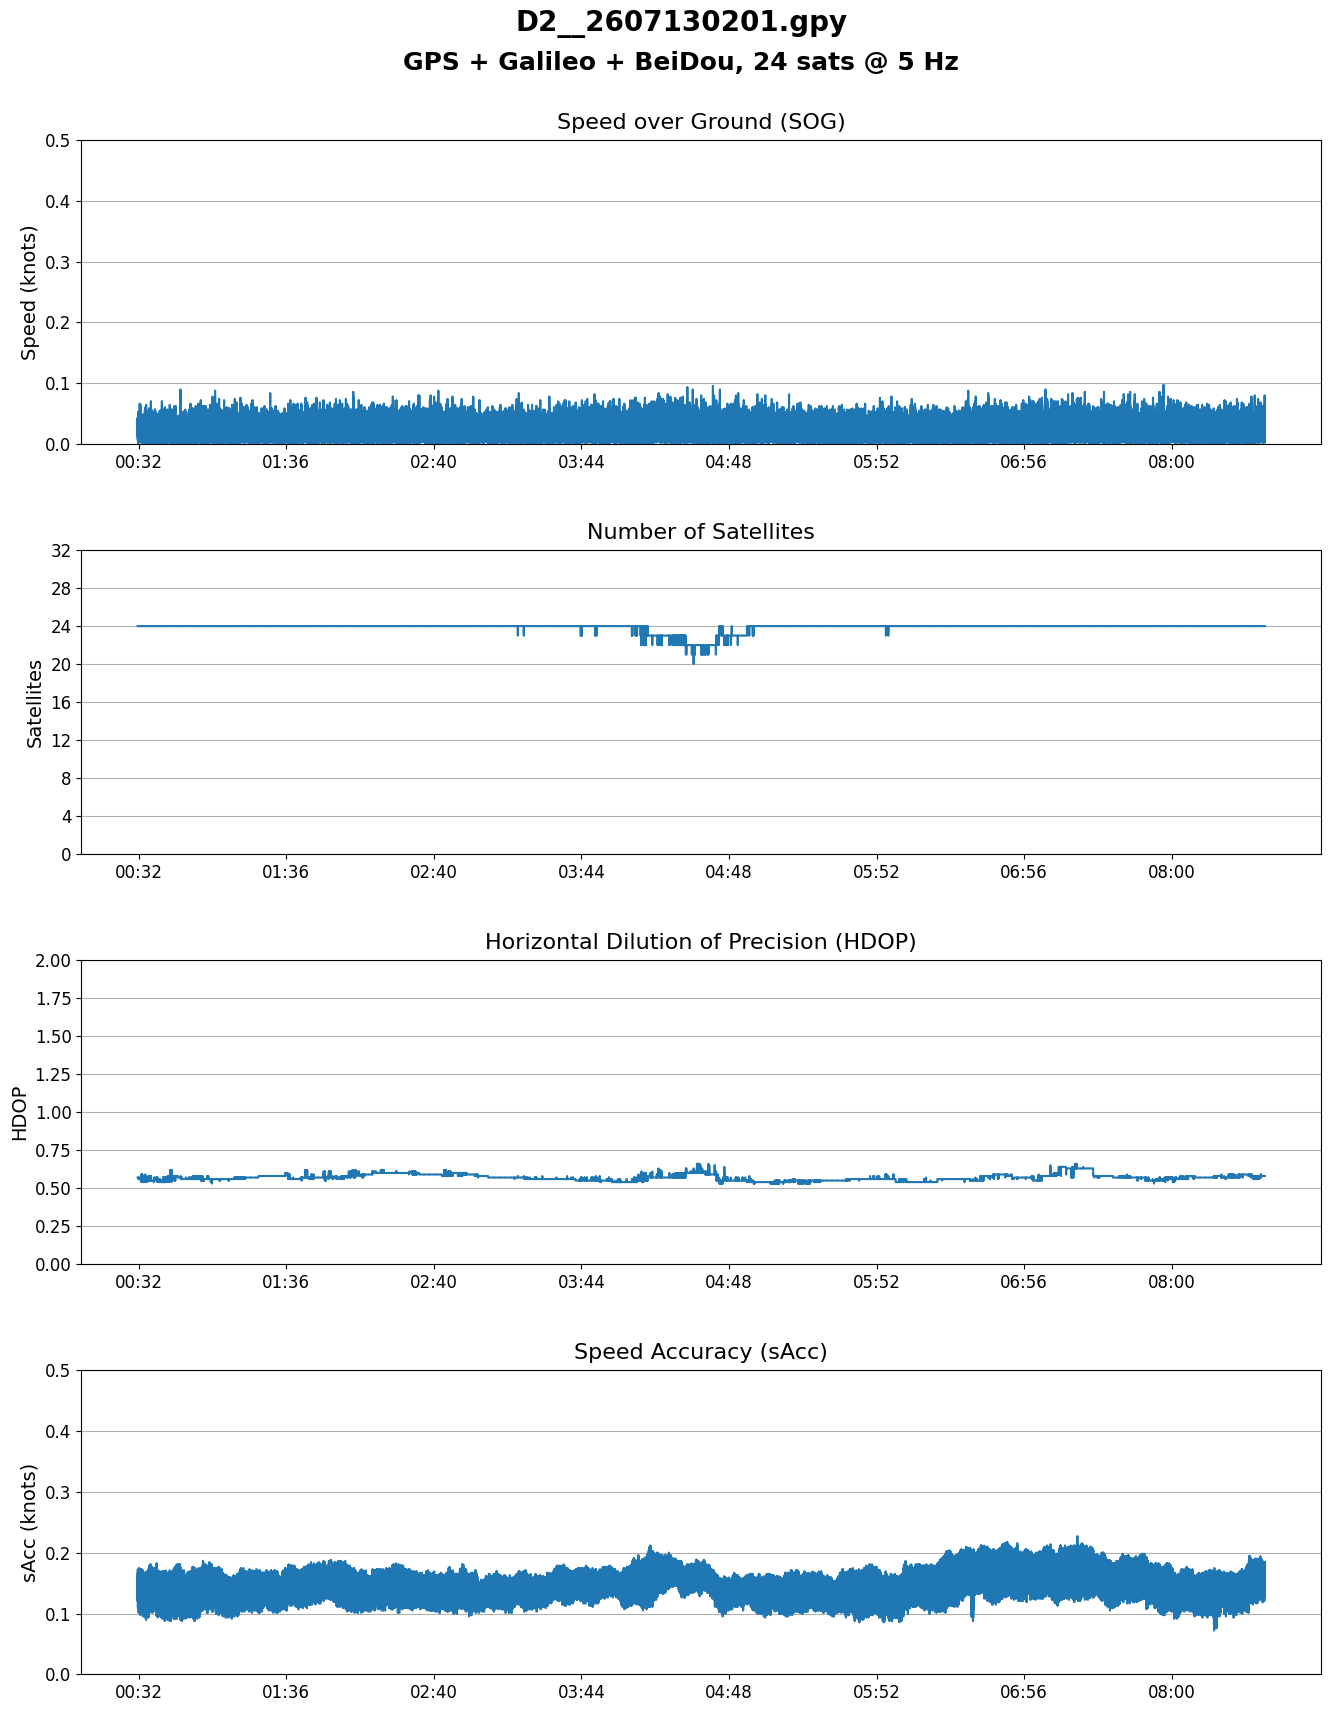
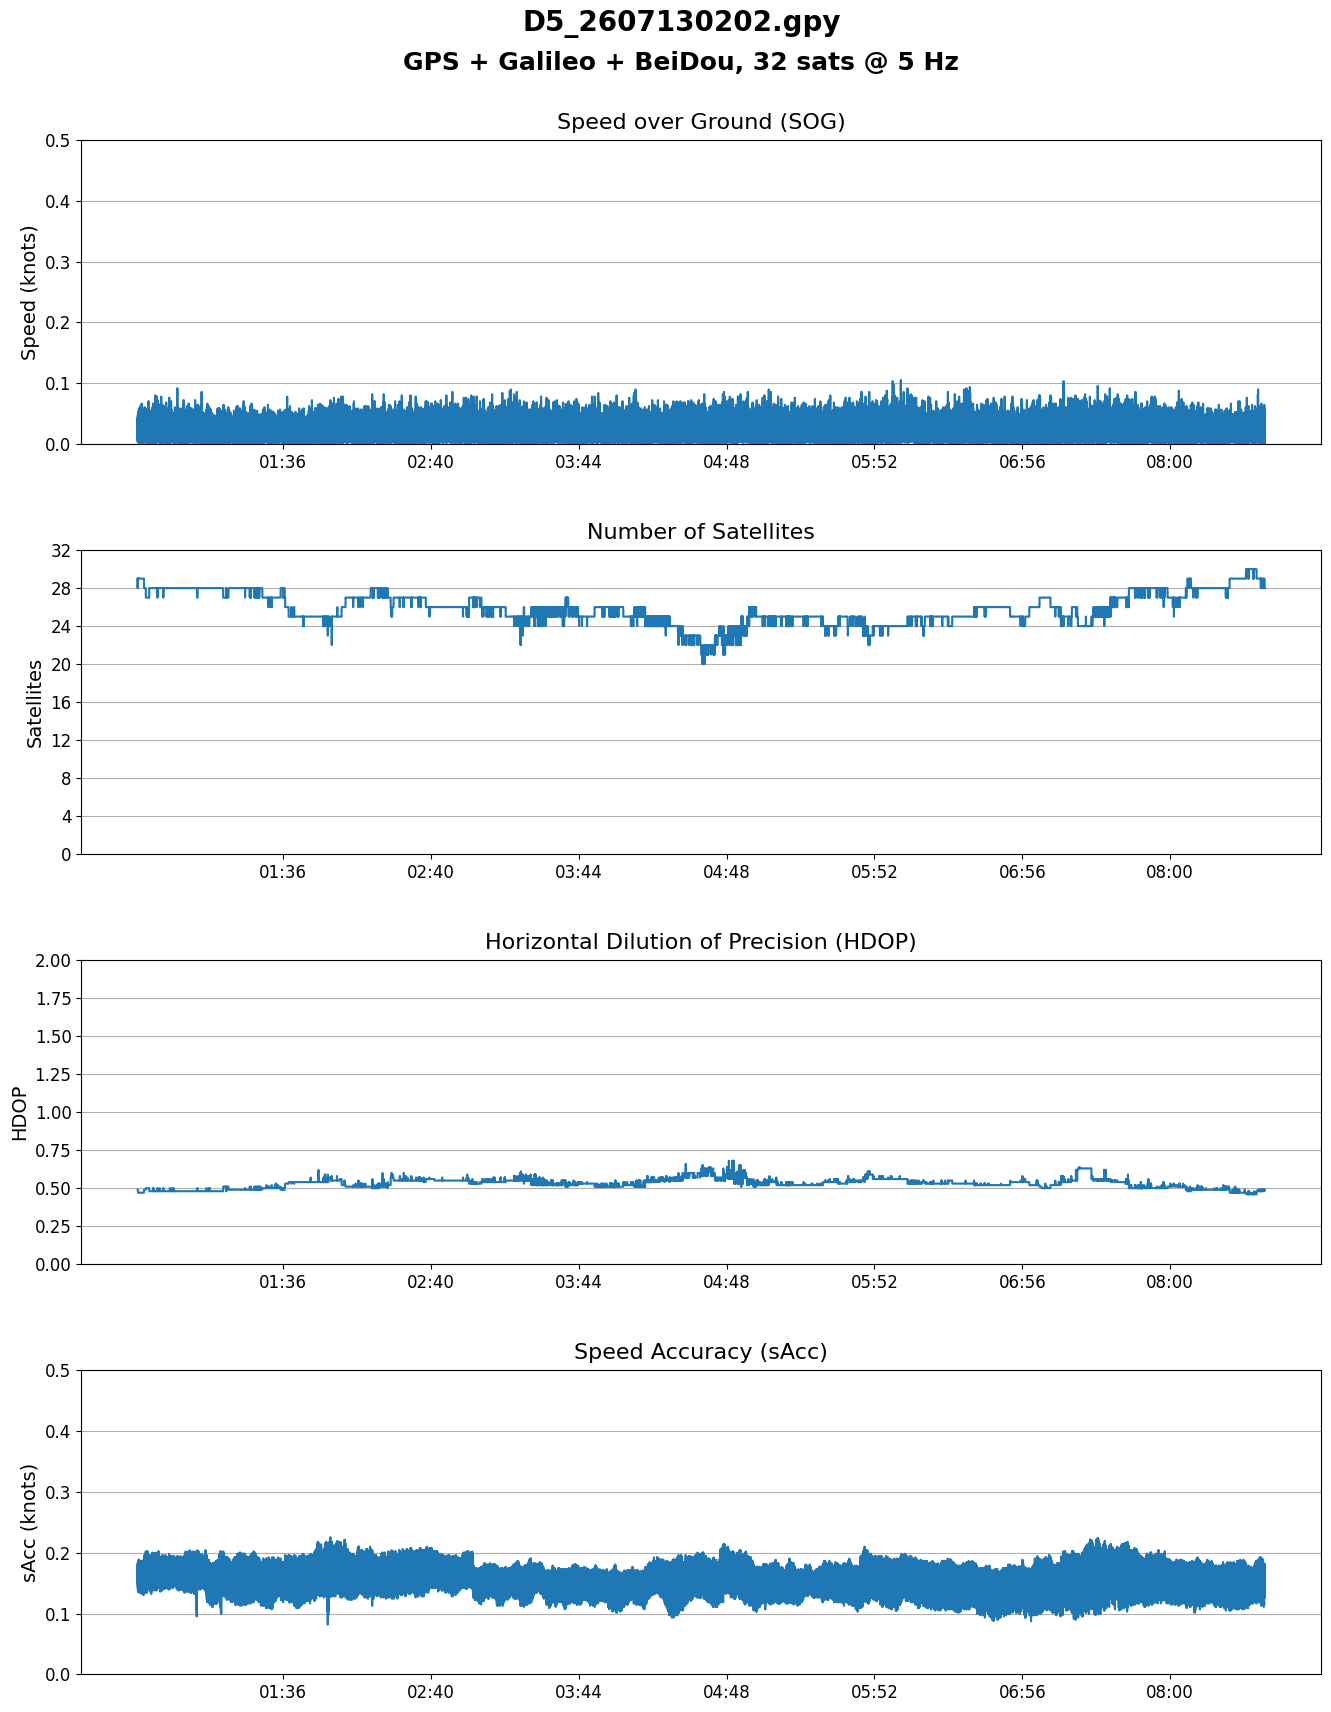
28 satellites (green) performed best, but it is also noticeable that SY1 and SY2 may not as good as the D devices.
The medians also suggest that SY2 and SY1 may not as good as the D devices.
The performances from the perspective of standard deviation were ordered in much the same way as the mean values.
Observations
-
28 satellites performed best @ 5 Hz
- The improvement over 24 and 32 is only minimal
- SY1 and SY2 did not perform as well as the D devices
- This has also been considered during phase 7
- 24 sats had vastly differing results for D2 and SY1
- D2 was good, SY1 was not as good
-
20 sats was worst, but that was SY2
- Will assign 20 sats to D5 during phase 7
- There were no dropped frames from any devices
- 80 MHz was too low (phase 4), but 160 MHz is fine
Conclusions
- 28 satellites is best @ 5 Hz, but 24 and 32 are pretty close
- Yet to be seen whether this also applies to 10 Hz
- The ESP32 @ 80 MHz is too slow for 5 Hz sample rate
- 160 MHz is required for contiguous logging @ 5 Hz
- 5 Hz seems to be much more accurate than 10 Hz
- The phase 5 results are very similar to phase 4
- D models perform noticeably better than the S models
- Reviewed previous phases, and their conclusions
- D models all have comparable performance
- D1 + D2 in phase 4, and D1 + D3 in phase 5