gps-wizard
Gated 500 m
Author: Michael George
Date created: 21 Sep 2025
Introduction
This document has been written relatively quickly to share some thoughts about the calculation of real-time 500 m results for Prince of Speed events.
Due to limited time it will not provide any detailed algorithms or formulas. It will describe the general concepts and also assume some basic understanding of how Global Navigation Satellite Systems (GNSS) work.
Topics will include a brief overview of GNSS accuracy, significance of positional errors and also the need for filtering / smoothing to cope with noise / sawtooth artefacts.
GNSS Overview
Positional Accuracy
The GNSS chipset inside any device is responsible for calculating Position, Velocity and Time (PVT) at fixed intervals, typically at 1 Hz, 5 Hz, 10 Hz or 20 Hz.
Position is calculated based on the time that it takes for the GNSS signals to travel from the various satellites to the receiver. This process is known as trilateration and errors can arise in the calculated position for a number of reasons. These reasons include errors in the satellite’s predicted position, deviations in the satellite’s atomic clock, atmospheric errors (ionospheric delay and tropospheric delay), multi-path errors, and electronic noise within the receiver itself.
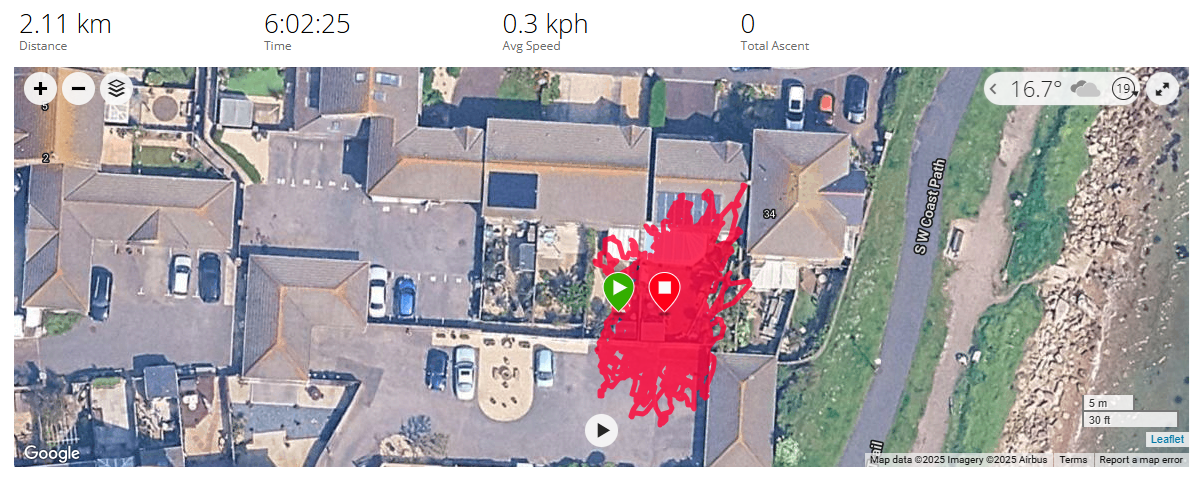
The effect of these errors can be illustrated with a stationary GNSS receiver, recording for several hours. The screenshot below shows a stationary receiver (Garmin Forerunner 645 Music) recording non-stop for 6 hours. There are a variety of statistics to summarise positional errors but the most common one used by GNSS chipset manufacturers is Circle Error Probable (CEP). CEP states that 50% of points are likely to be within the specified distance from the true location and 50% will be farther away. u-blox GNSS chipsets generally quote a CEP of either 1.5 m or 2.0 m, which can therefore be considered the median error.
Speed Accuracy
The GNSS chipset within a receiver also calculate Speed Over Ground (SOG) but it does not calculate this by measuring the distances between points. The GNSS signals are subject to the same Doppler effect that causes the pitch of a police siren or sound of a racing car to change, depending on whether it is getting closer or farther away. GNSS receivers constantly monitor the Doppler shift (change in carrier frequency) whilst acquiring and tracking the signals, but this information provides an additional benefit. The Doppler shifts themselves can be used to calculate the speed of the receiver!
The benefit of the Doppler-derived speeds is that they are immune to the majority of error sources that affect positional accuracy. This is why websites such as GPS-Speedsurfing have been using Doppler-derived speeds for their rankings for almost 20 years. Generally speaking, errors in the Doppler-derived speeds are an order of magnitude lower than the errors in position-derived speeds. However, GNSS chipsets from some manufacturers (including u-blox) may also use an approach called carrier-smoothing which improves the pseudo-range measurements and thus positional accuracy.
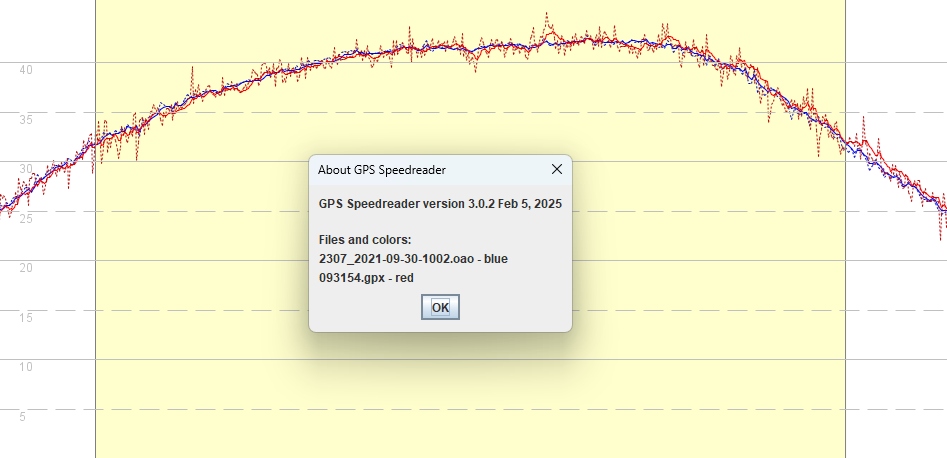
The image below compares a 20 Hz custom u-blox device (red) and 10 Hz Motion (blue) with the solid lines being the Doppler-derived speeds and dotted lines being the position-derived speeds. The data from the 20 Hz custom device is noisier than the Motion, especially the position-derived speeds (dotted red line), possibly due to the fact that the 20 Hz device is not using so many GNSS constellations, or possibly because of components such as the antenna or TCXO, or possibly due to electronic noise within the receiver itself. Whatever the cause we can clearly observe inaccuracies in the 20 Hz positional measurements.
Algorithms / Approaches
500 Meter Course
The 500 m course in La Palme is the same for every Prince of Speed event. It has been defined in GPSResults to include the beach, so that tests can be performed on a motorised vehicle such as a quad bike. During foiling heats the width of the course also needs to be doubled to capture all of the runs.
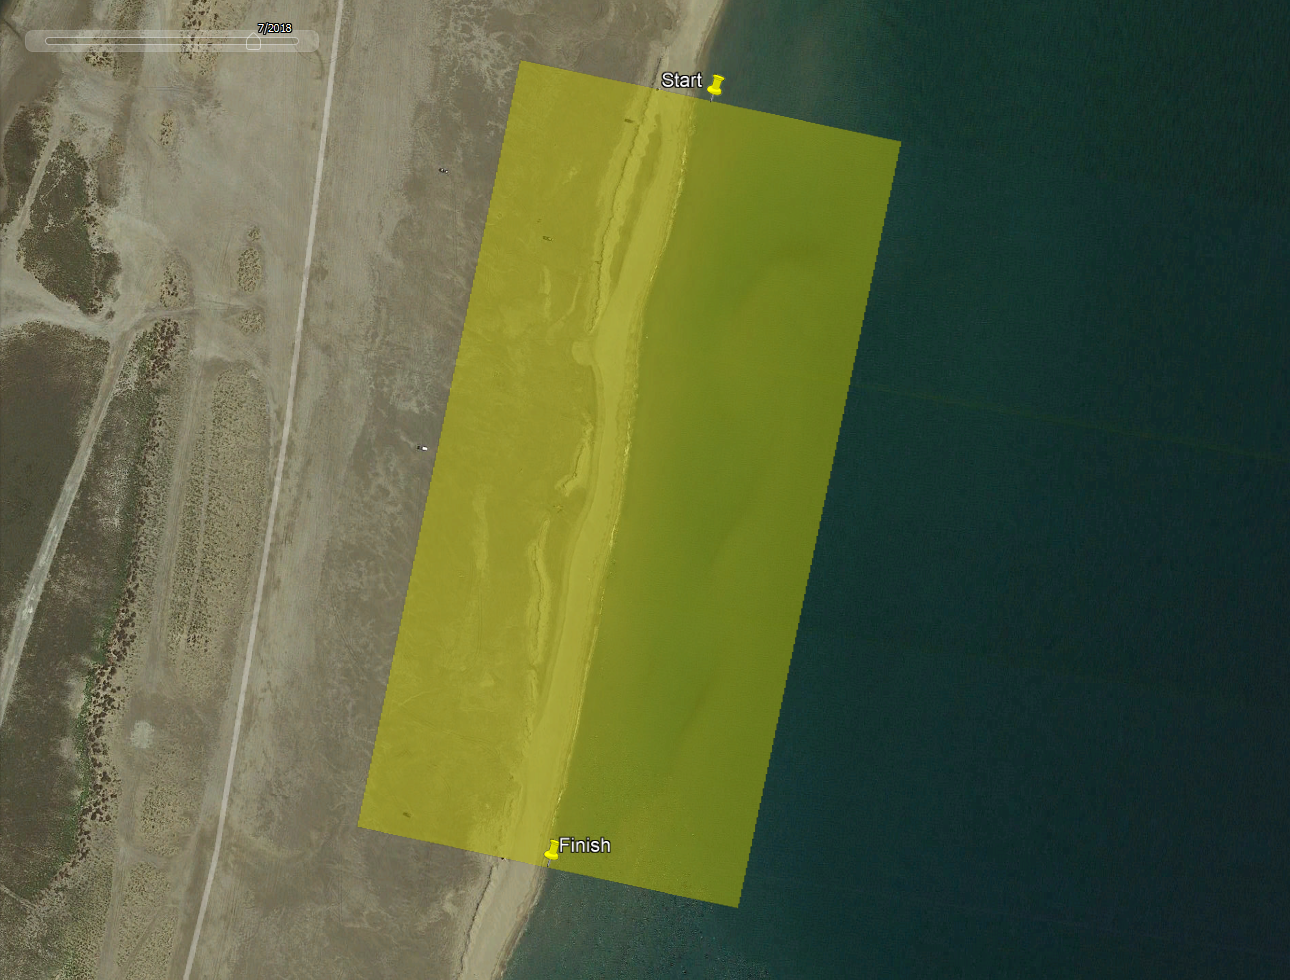
An imaginary run is shown below, just to illustrate how runs may not be parallel to the course. It is the time taken between the start and finish lines that matters, or thinking more abstractly the average velocity parallel to the course.

Position-Derived Speed
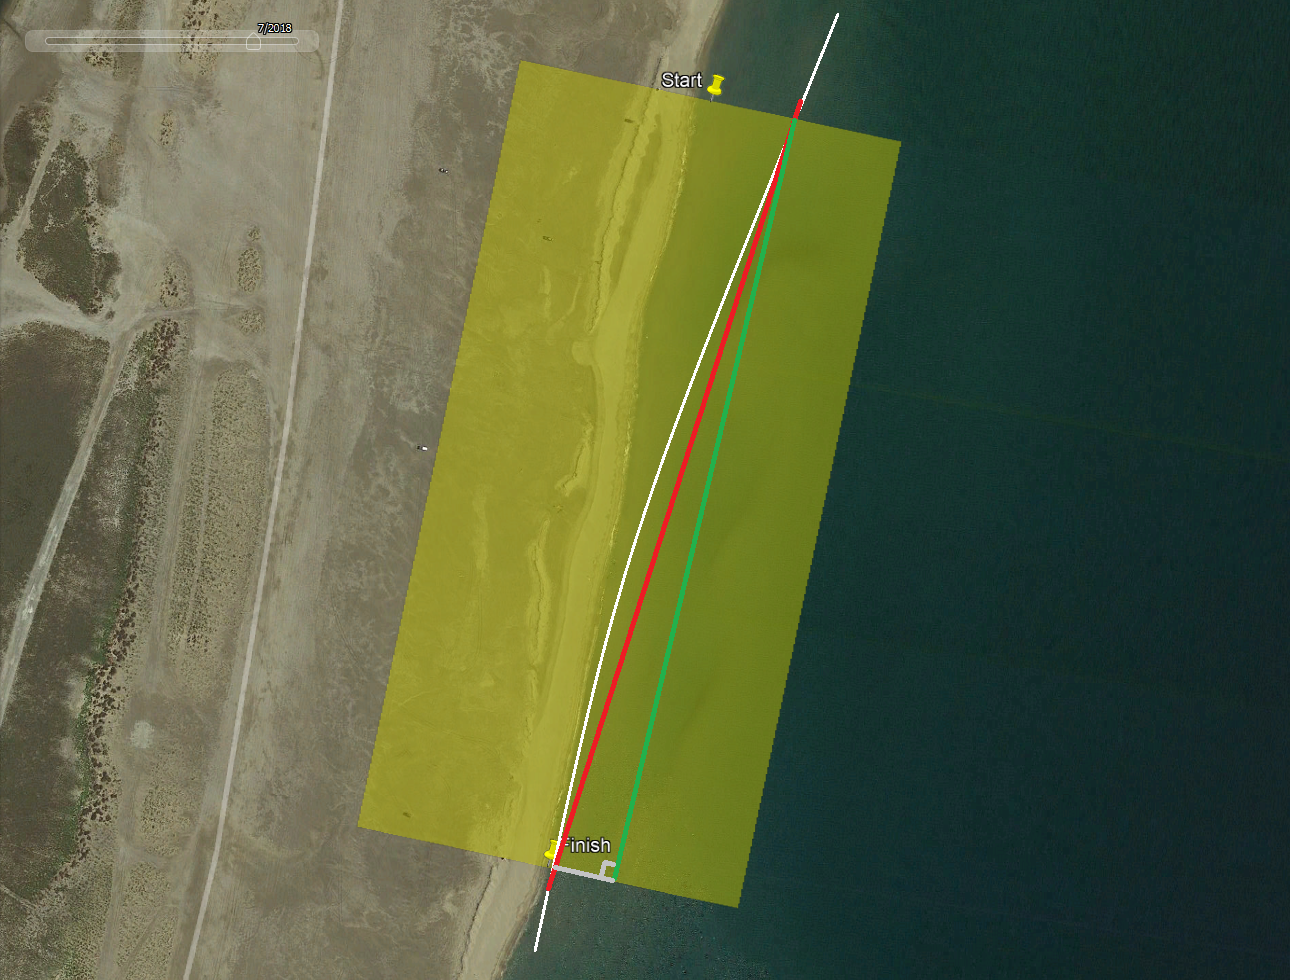
When recording at 10 Hz, board speeds of 45 knots (23 m/s) will result in points that are 2.3 meters apart. The image below slightly exaggerates a straight line from the point immediately prior to the start line to the point immediately after the finish line (shown in red). The speed between the start and end points can easily be calculated (speed = distance / time) but that is not what the competition requires.

It is the average velocity parallel to the course which is required, shown in green. It is worth noting that although the start and end points may be a couple of meters from the start / finish lines the effect of those discrepancies is rarely significant.
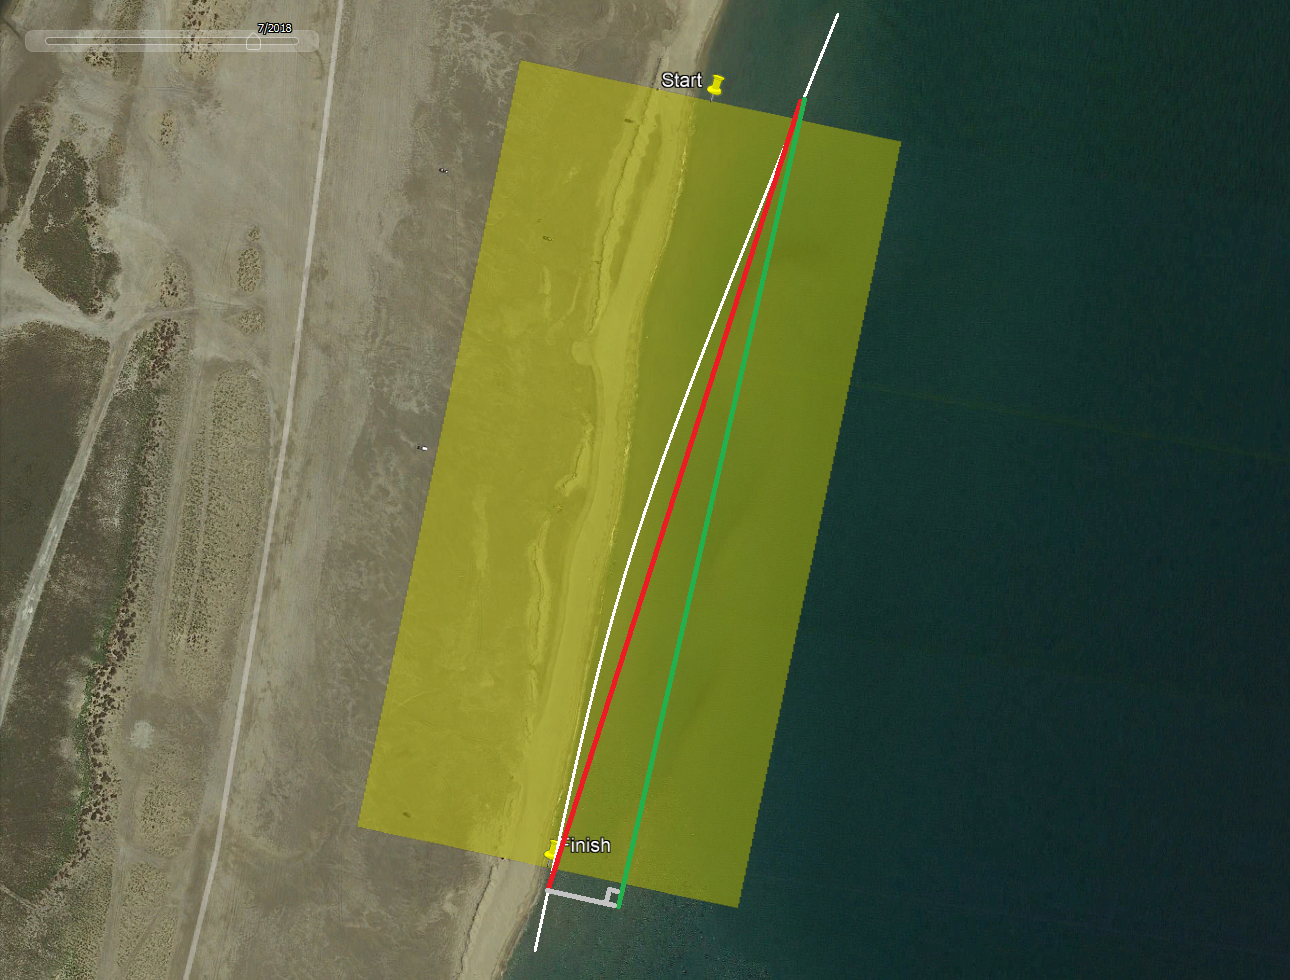
Interpolation may be used to identify the (likely) position and time when the rider crossed the start / finish lines. The average velocity down the course can then be calculated by dividing the course length by the time interval between the interpolated points, so speed = distance / time.
Note: If interpolation is used then the effects of “noisy” positional data should be considered. The graph shown earlier included a dotted red line for position-derived speeds (20 Hz custom u-blox logger) with lots of “sawtooth” artefacts due to positional inaccuracies. The sawtooth artefacts represent unrealistic changes in positions and thus some kind of filtering / smoothing needs to be employed prior to any interpolation.
One possible approach would be to use a centred moving average (CMA) with a period of 2 seconds, then using linear interpolation between the points either side of a start / finish line. In theory acceleration / deceleration could be considered when trying to determine where the lines were crossed but the calculated acceleration / deceleration is even more noisy than position-derived speeds, so simple linear interpolation is likely to be more effective.
Time-Derived Speed
The point immediately prior to the start line and the point immediately after the finish line will always give an elapsed time exceeding the true time that it took to sail the course. This is because the start and end points can potentially be up to 2.3 meters from the start / finish line when sailing at 45 kts (23 m/s) with 10 Hz logging.
At the extremes, this could mean an elapsed time relating to a 500 meters or 504.6 meters. Thus, unlike the position-derived approach it is not possible to simply use the point immediately prior to the start line and immediately after the finish line. Some kind of filtering / smoothing and interpolation will be required.
Note: 20 Hz logging may halve these discrepancies but on the flipside the positions themselves may be less accurate, especially if less GNSS constellations are used in favour of the higher logging rate.
For reliable 500 m results to be calculated on the basis of course length / elapsed time, it will be necessary to determine when the rider crossed the start and finish lines. So, this is essentially the exact same calculation as described earlier (position-derived speed with interpolation) and thus requires some filtering / smoothing to ensure that interpolation (calculation of the intersection with the start / finish line) is reliable.
Doppler-Derived Speed
The third possible method is to use the Doppler-derived Speed Over Ground (SOG) and Course Over Ground (COG) to determine the average velocity parallel to the course itself. This involves calculating individual velocity-vectors parallel with the course, adding them up and dividing by the number of points to give an average.
This is essentially what has been done inside GPSResults during the history of the Prince of Speed. The image below attempts to illustrate this and just like position-derived speeds, start / end points that are before / after the start / finish points do not usually have any noticeable impact. Filtering / smoothing and interpolation are still possible, but not essential.

Which is Best?
For 2 secs, 10 secs and un-gated 500 m it is widely recognised that that use of Doppler-derived speeds produces much more accurate results. It becomes somewhat more nuanced when it comes to calculating results for the gated 500 m.
-
Errors relating to Doppler-derived speeds are cumulative (over 500 meters) but to a large extent cancel out, essentially oscillating around the true values. There are some exceptions to this rule though, such as when the signal reception is significantly impaired.
-
Errors relating to position-derived / time-derived results are primarily dependent on the accuracy of the start and end points. Positional errors tend to be similar for adjacent and nearby points, but they can change by several meters during a 500 m run.
Filtering / smoothing of positional data prior to interpolation (calculating intersection with the start / finish line) may slightly improve the reliability of position-derived results, but will not entirely mitigate the risks associated with positional data.
Filtering / smoothing and interpolation will almost certainly be required for time-derived results. Failure to do so could result in occasional errors up to 0.4 kts at 45 knots and with 10 Hz logging, additional to any error due to changes in positional inaccuracies.
20 Hz logging will increase the resolution (how close the start and finish points are to the start / finish lines) but will not increase accuracy per-se. If the higher logging rate requires a reduction in the number of GNSS constellations then positional accuracy may decrease.
As mentioned earlier, position-derived results using filtering / smoothing and interpolation are essentially the same as time-derived results using filtering / smoothing and interpolation. For most runs, position / time derived results should be similar to Doppler-derived results.
How to Test?
Testing of a GNSS logger such as the LISA may take place during an official competition or at any other time.
If the GNSS logger is capable of calculating results for a 500 m course, it would be useful if it logs all gated results to the SD card.
In this way the real-time results can easily be compared to the Doppler-derived and position-derived results of GPSResults.
Confirming the reliability of the results will require a fair amount of testing, but I would be happy to assist / review the results.
Further Work
Notes:
- The gates for GPSResults have adjacent corners that represent a 501 meter course, consistent with Prince of Speed wording.
- GPSResults appears to be using Vincenty’s formula for 501.0 meters, because the Haversine formula produces 501.4 meters.
Investigations:
- Replicate the GPSResults time / distance results in Python.
- Compare doppler and positional results, re-calculating Farrel Cup runs and looking for significant differences.
Python examples:
- Line intersection will be useful for calculating start / end points for interpolated start / end times
- Bearing may be useful for identifying the general direction of the course