gps-details
Motion Mini - Rate Investigation
Walking Tests
Overview
The walking tests are intended to provide insight into changes of acceleration and deceleration (aka jerk), due to swinging of the arms. The chosen route is an excellent open-sky environment and the walk itself contained periods both with and without arm movement.
The purpose of this particular test was to determine if there is any difference in behavior between motions logging at 1 / 2 / 5 / 10 Hz. Perhaps the most interesting observation is that walking provides an excellent real-world illustration of the Nyquist-Shannon sampling theorem.
Warm Up
Prior to testing the motions were given a minimum of a 15 minute warm up, allowing for signal acquisition and enough time to acquire the ephemerides.
Data
All of the data is available for download in OAO format:
- 2024-06-18-walk.rar - newer motions logging @ 1 / 2 / 5 Hz
- 2024-06-19-walk.rar - older motions logging @ 1 / 2 / 5 / 10 Hz
Day 1
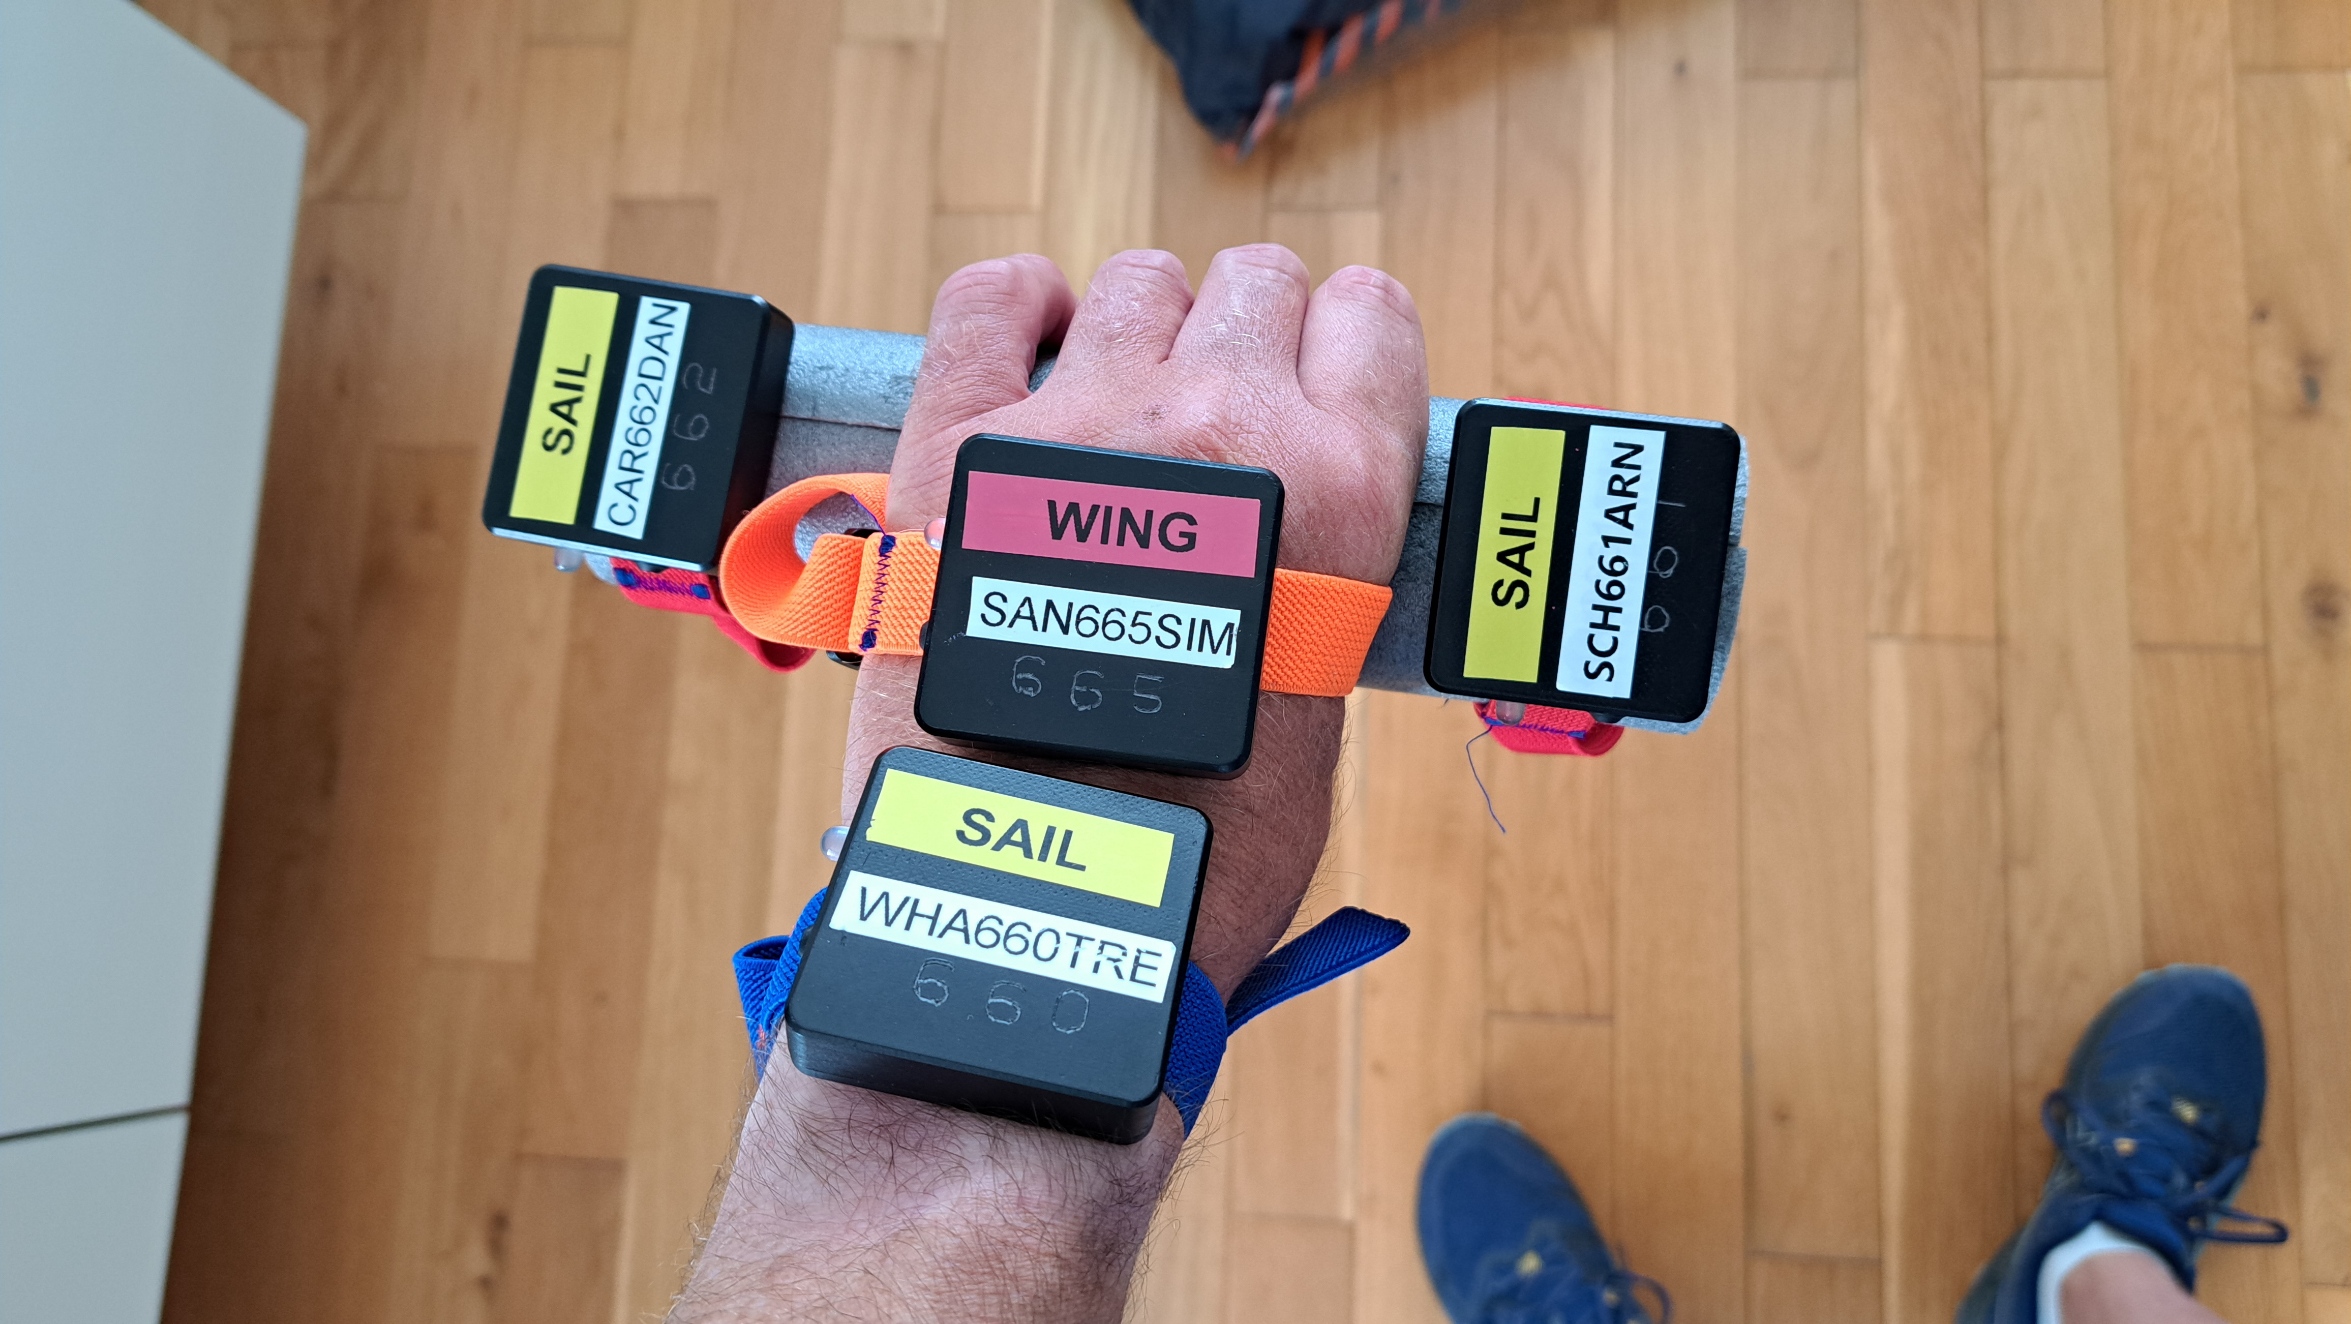
Testing on 18 June used the newer style mini motions, logging at 1 / 2 / 5 Hz.
The last digit of the serial numbers indicates the logging rates and the motions.
The motions were held such that 1 Hz and 2 Hz would experience near-identical acceleration and deceleration. Left hand:
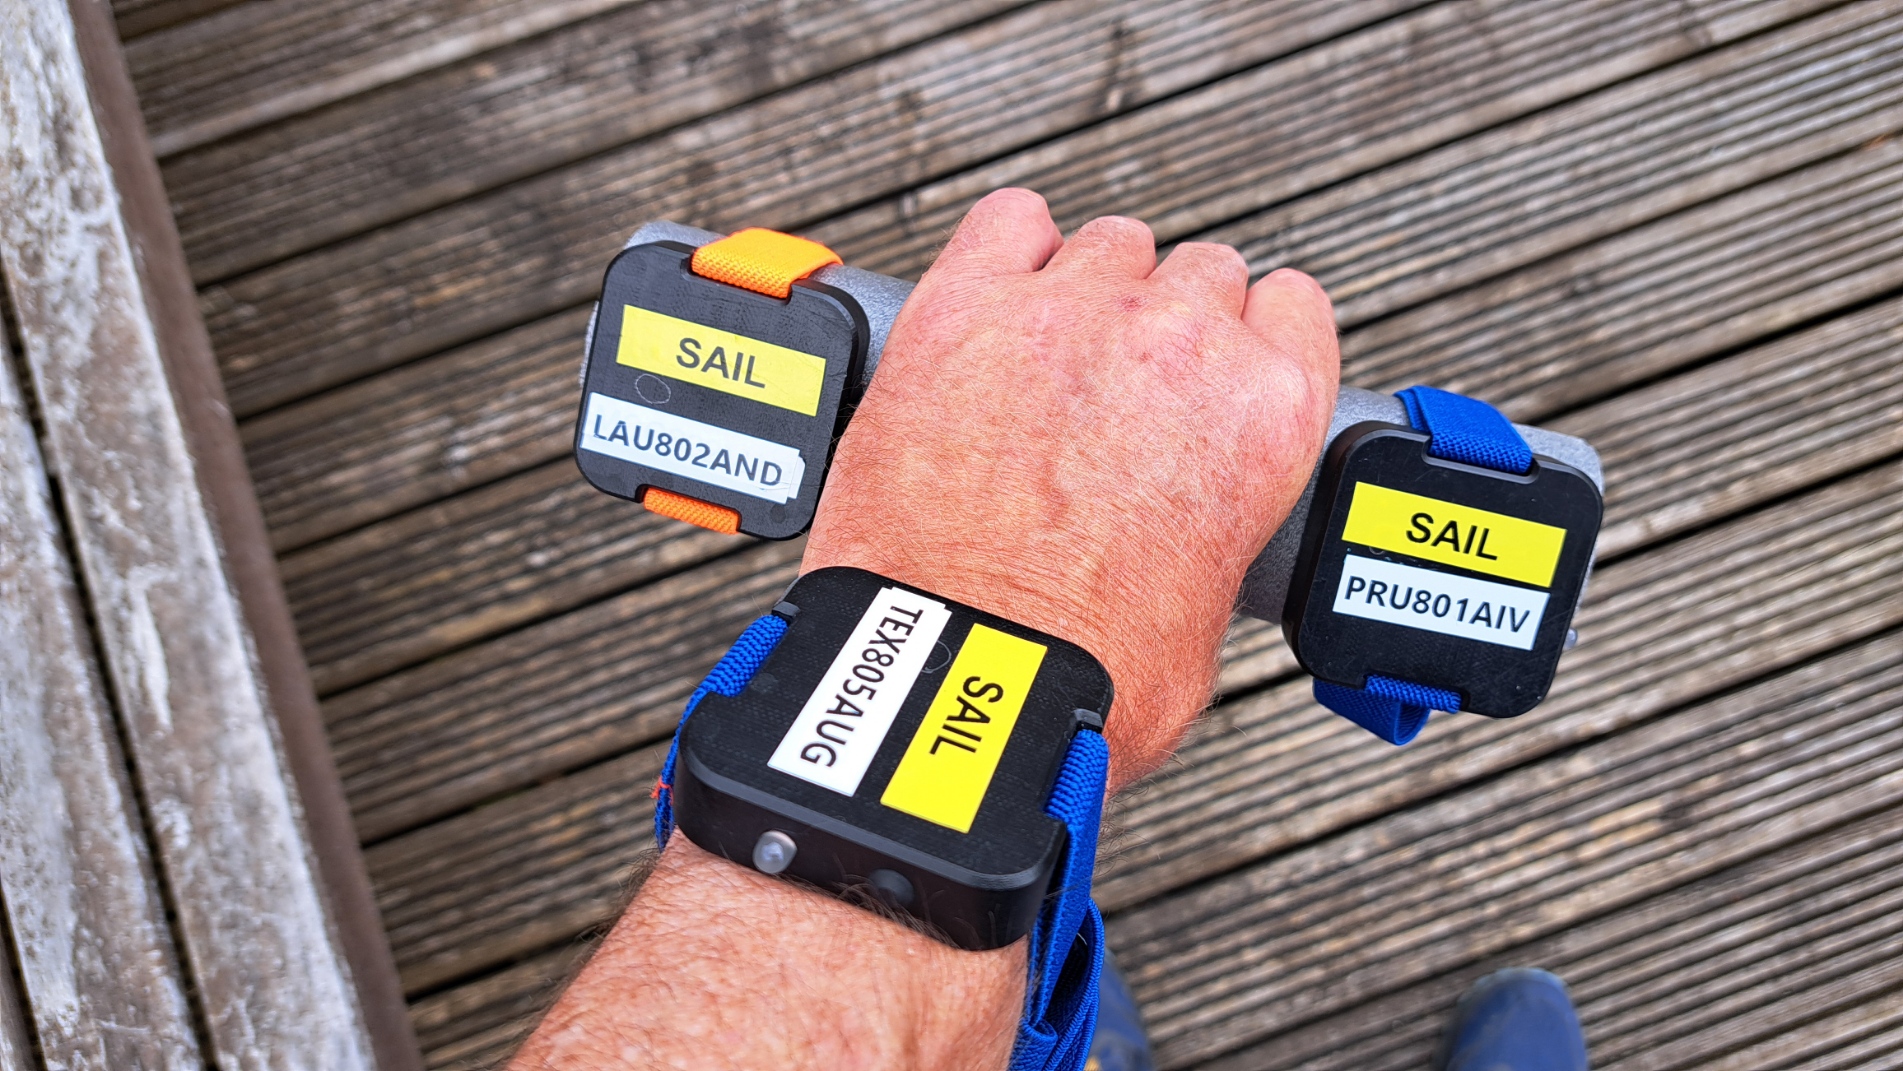
Right hand:
Viewing the 5 Hz data in GPS Speedreader clearly shows the effect of swinging the arms; speed over ground (SOG) ranging between 0 and 6 knots:
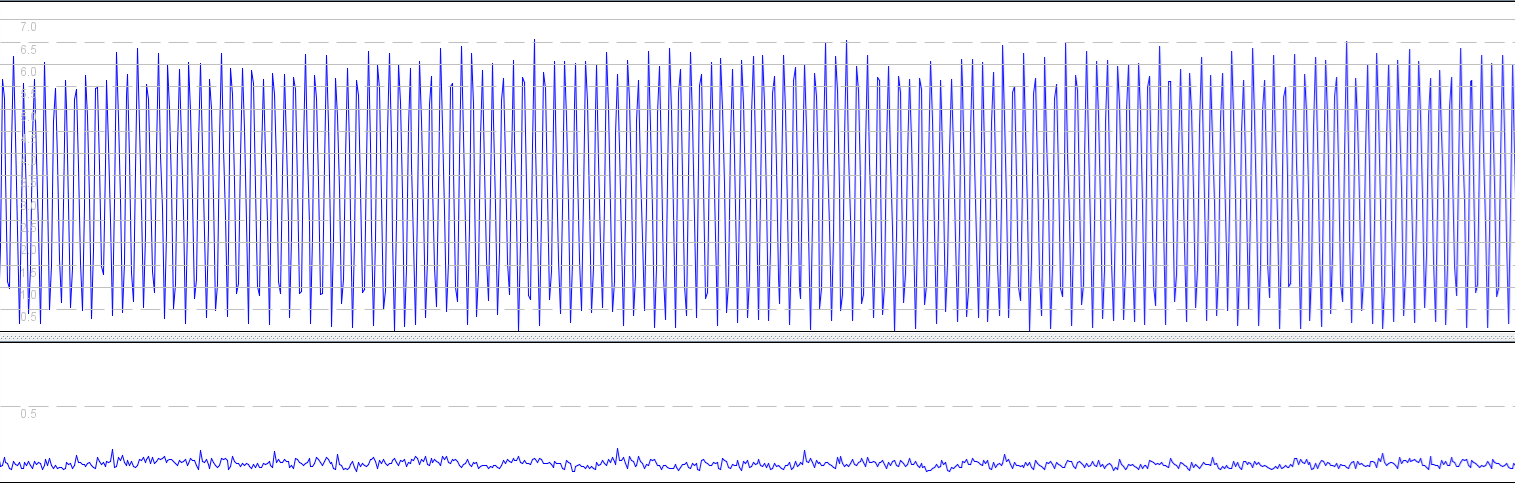
The 2 Hz data does manage to capture the cadence of the swinging arms correctly, but exhibits an interesting beating pattern:
The 1 Hz data is a sinusoid showing a completely different cadence to the 5 Hz data, with a period of around 10 seconds.
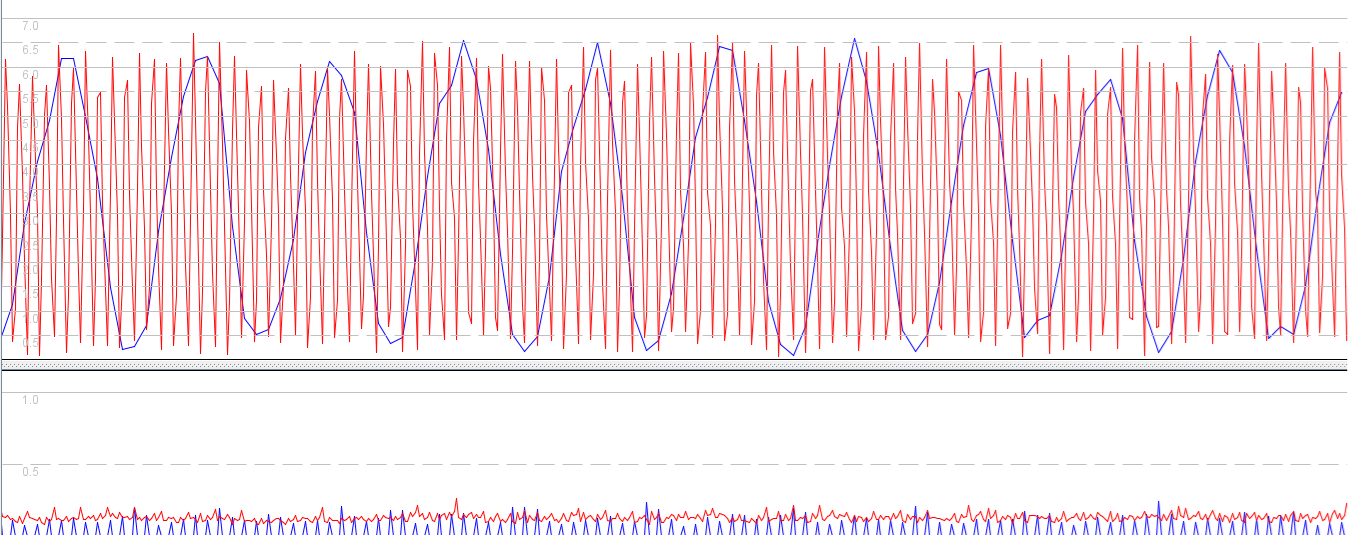
Comparing the 1 Hz and 2 Hz data there is a clear relationship between the beating pattern and the sinusoid:
The artefacts in the 1 Hz and 2 Hz data are referred to as aliasing and can be explained by the Nyquist-Shannon sampling theorem.
A walker / runner is unlikely to be interested in measuring their arm speed, but this phenomena does illustrate why a higher logging rate can be useful. If you want to record accurate speed data when movements are jerky, then one must choose a suitable logging rate.
Sports watches tend to implement heavy filtering for activities that involve arm movements, and it should be quite evident why this is necessary. Besides the actual movements taking place, 1 Hz aliasing effects could result in extremely misleading data being recorded.
Day 2
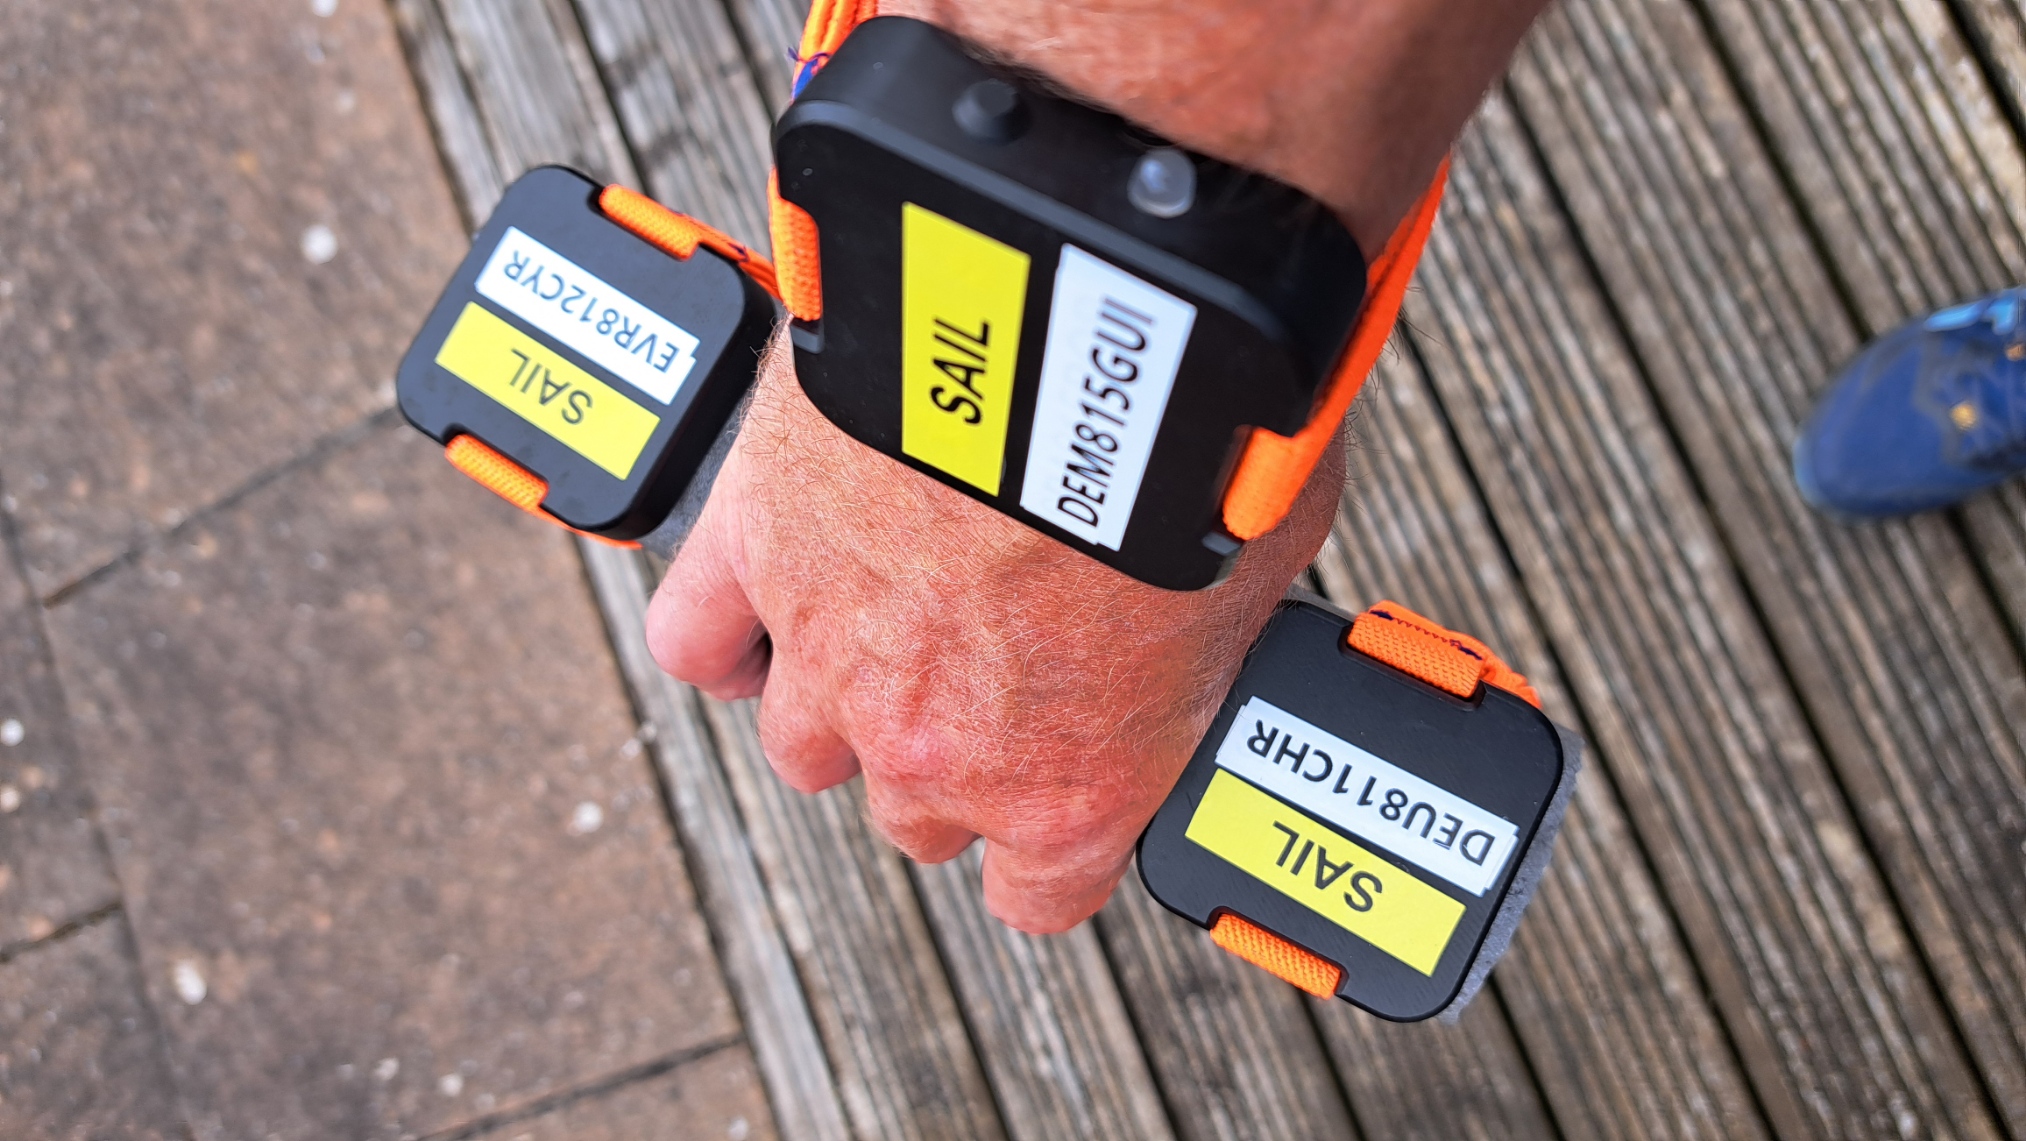
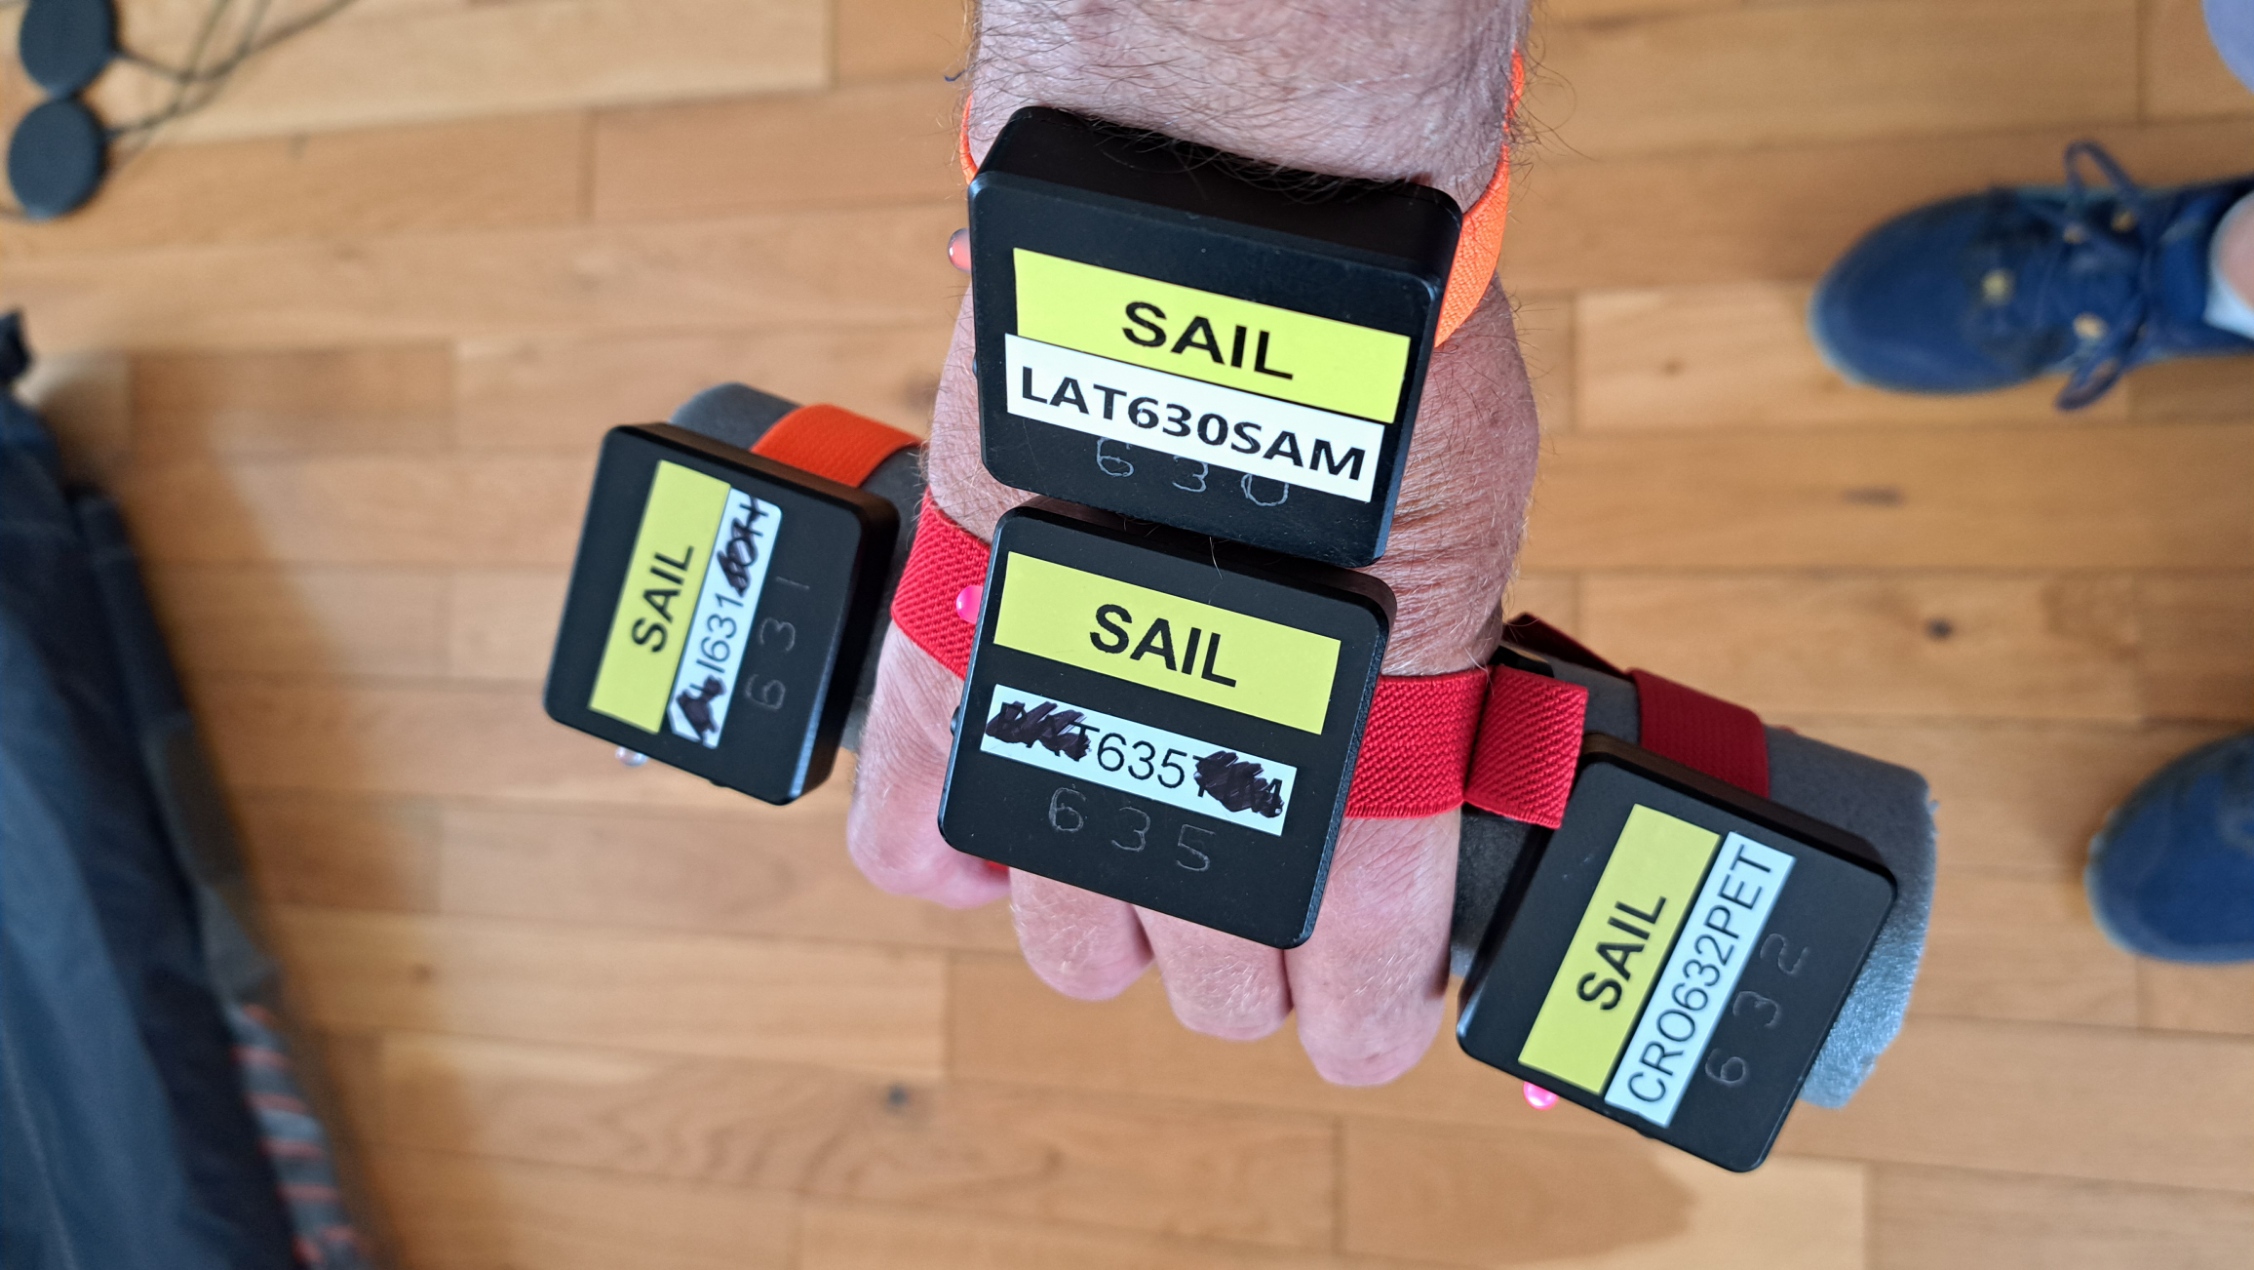
Testing on 19 June used the older style mini motions, logging at 1 / 2 / 5 / 10 Hz.
The last digit of the serial numbers indicates the logging rates and the motions.
The motions were held such that 1 Hz, 2 Hz and 5 Hz would experience near-identical acceleration / deceleration. Left hand:
Right hand:
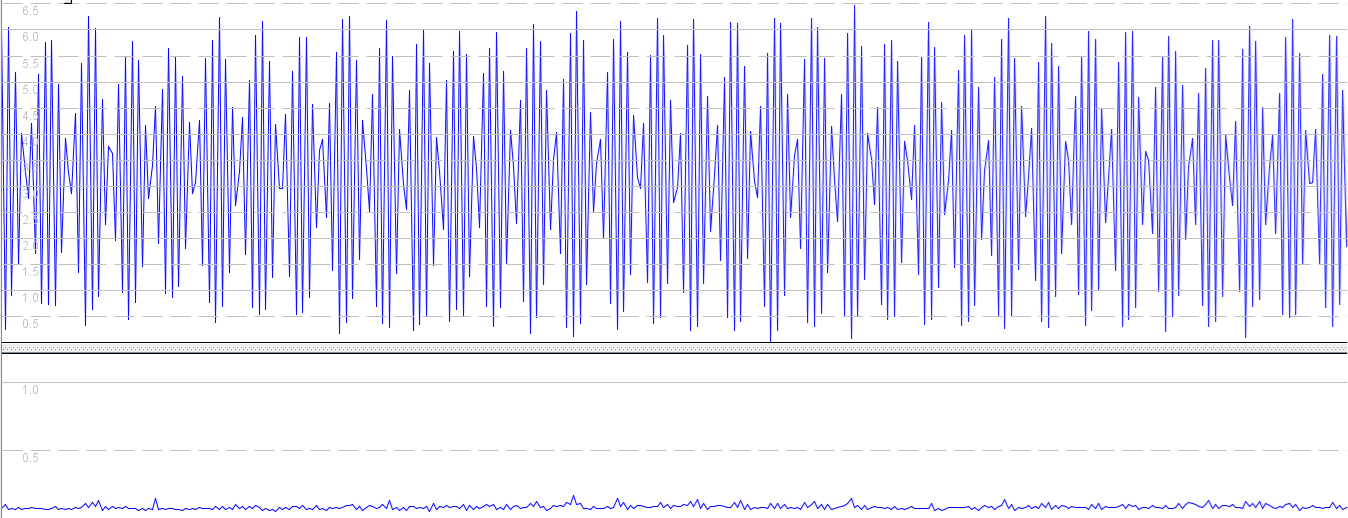
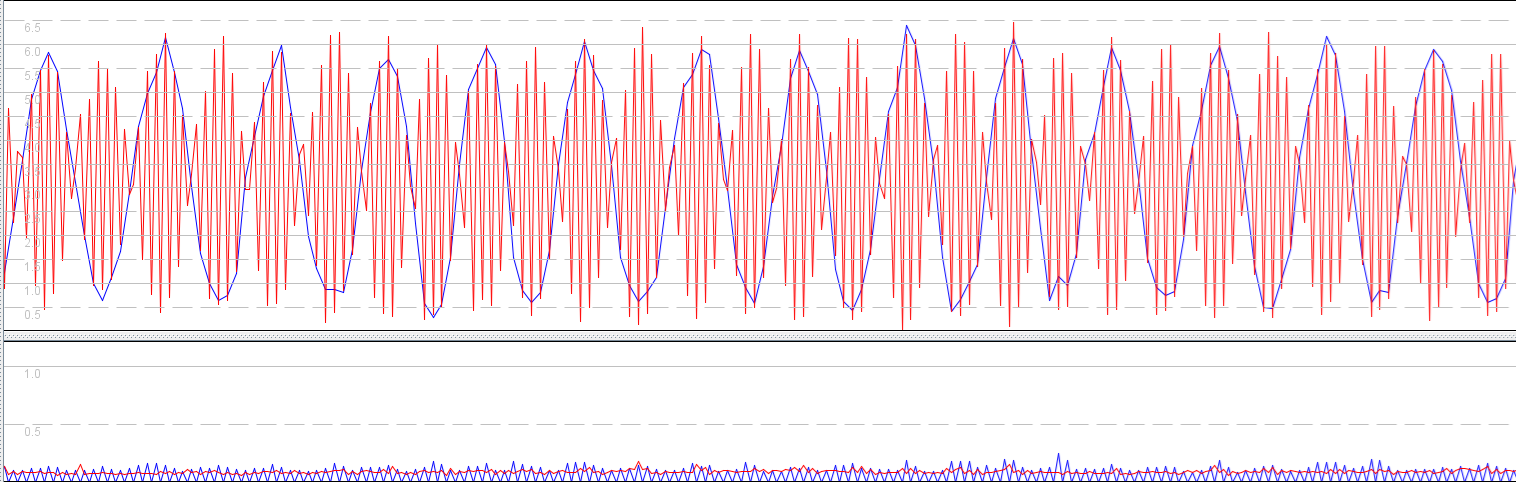
When comparing the 1 Hz (red), 5 Hz (green), and 10 Hz (blue) data it can be seen that the higher logging rates tell much the same story:
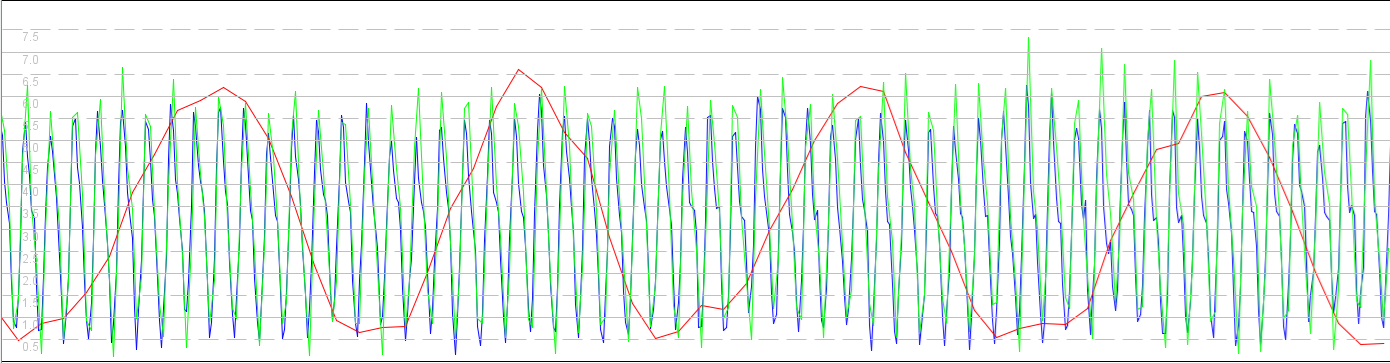
It is worth noting that you might expect a slightly smaller range of speeds in the 10 Hz data (blue), due to where it was being worn in relation to the other devices. This does seem to be evident in the above illustration.
Just like the previous walking test, 1 Hz data resembles a sinusoid but this time with a period of around 15 seconds. It would appear that a slightly different walking cadence has altered the period of the sinusoid in the 1 Hz data.
The 2 Hz data also exhibits a beating effect, similar to the one seen in the previous walking test:
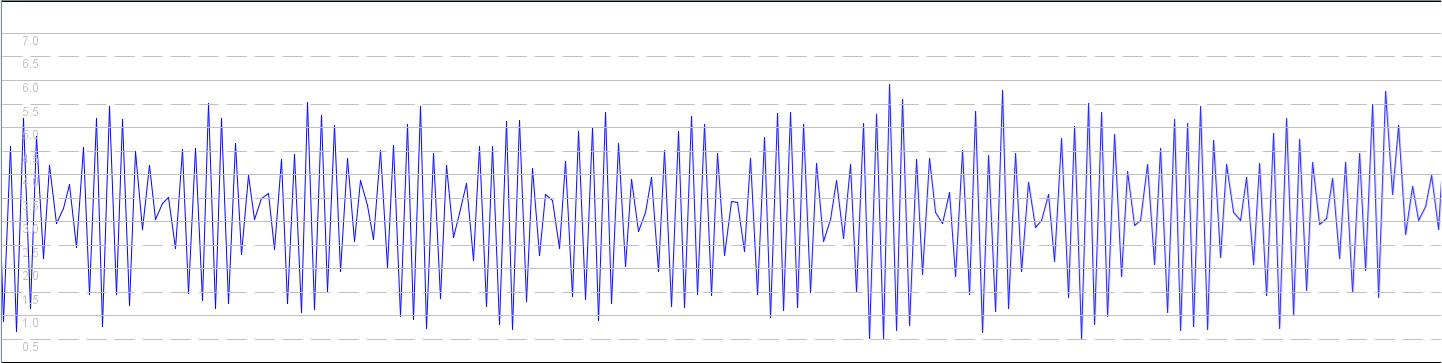
So it would appear that the 5 Hz and 10 Hz data consistently capture the speed and acceleration of the receiver, but the 2 Hz and 1 Hz data can be very misleading.
My original notes included the following points:
- 0631 vs 0635 demonstrates that 5 Hz includes more noise during a steady walk, without swinging of the arms.
- This can easily be mitigated by filtering / smoothing / averaging either in real-time, or within post-processing.
- 5 Hz and 10 Hz data is almost identical during a steady walk, without swinging of the arms.
- Some slightly unrealistic artefacts (possible noise) seem to be present from motion 660 (10 Hz) mid-swing?
- It is good to compare specific combos individually - e.g. 5 + 10 + 1 Hz, or 5 + 10 + 2 Hz, or 2 + 1 Hz.
- 630 (10 Hz) seems a little iffy during arm swinging - max speed too low, but min speed ok?
- 660 and 665 seem to be the best bet when comparing 10 Hz / 5 Hz against 2 Hz / 1 Hz.
- 2s and 10s speeds from 1 Hz data are a complete nonsense, reporting several knots higher than the reality!
- Need to use 250m or 500m to get closer to the truth.
- This clearly illustrates why sports watches need heavy filtering for activities involving arm movements.
- 2 Hz data is better than 1 Hz, although it does exhibit a beating pattern.
- It may be possible to improve the 2 Hz data with complex post-processing, but logging at 5 Hz is a lot easier!
- Note the identical beating pattern in the position-derived and doppler-derived speeds of the 2 Hz track.
- The position-derived and doppler-derived speeds are also very similar in the 1 Hz data with its sinusoid.
Conclusions
The basic conclusions are as follows:
- If you want to record accurate speed data including jerky movements, then you must choose a suitable logging rate.
- 5 Hz will capture arm movements when walking, but other activities / scenarios may require higher logging rates.
- Higher rates aren’t always necessary. e.g. 1 Hz appears to be fine for car journeys which do not exhibit jerkiness.
The Nyquist theorem explains the artefacts / aliasing in 2 Hz and 1 Hz data when walking.
- Interesting beating effect in 2 Hz data and misleading sinusoids in 1 Hz data.
- When walking, 2s and 10s speeds are completely wrong when logging at 1 Hz.
- Need to use longer time / distance for the sinusoidal effect to be attenuated.
- Max 2s is largely unaffected for 2 Hz logging but the beating effect still presents an issue.
- Need to use filtering / smoothing / averaging to get sensible results, or choose a higher logging rate.
- Conceivable that similar artefacts / aliasing could also happen when pumping the sail with a specific cadence.
Todo
Compare 5 Hz + 1 Hz motions against other 1 Hz devices:
- Test GW-60 and GW-52 in 5 Hz and 1 Hz modes during walking, looking for evidence of similar aliasing in 1 Hz data
- Previous testing suggested slightly dampened hand speeds from the GW-60 - perhaps attenuated by the Kalman?
- Test Forerunner 255 using “bike” and “other” activities
- Previous tests contain a hint of 1 Hz aliasing - see 15601197246_ACTIVITY (bike) and 15601243271_ACTIVITY (other)
References
- Nyquist theorem within the context of GPS - Seabreeze forum
- Aliasing beating frequency - DSP StackExchange
- Why does twice the sampling rate (Nyquist Theorem) seem inadequate? - DSP StackExchange
- Beat occurs while analog voltage measurement - NI forum