gps-details
Garmin Activity Testing
Author: Michael George
Created: 9 July 2024
Overview
This page documents activity testing that was performed on 2024-06-30, whilst walking in an open-sky environment.
It compares the two activities - Cycling and Other.
- Forerunner 255
- Cycling
- Other
- Cycling
- Other
1 Hz and 5 Hz data was also collected using Motion Minis.
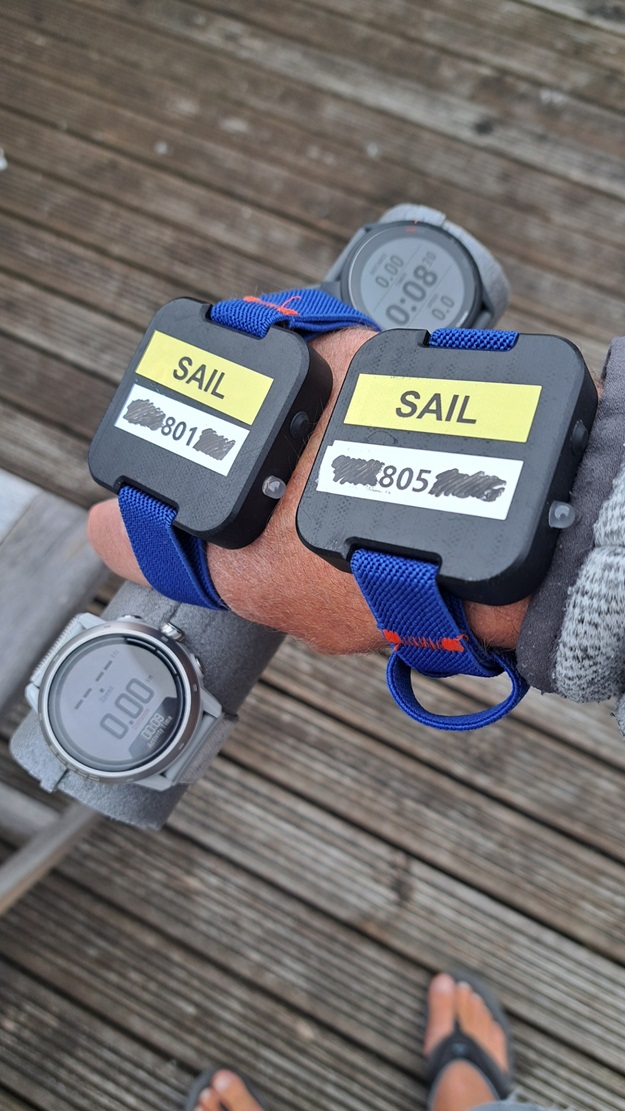
The devices were carried as shown in this photograph, including a COROS APEX 2 Pro on the left:

Data
All of the FIT data is available for download in ZIP format:
- 2024-06-30-walking-fr-255.zip - Forerunner 255
The OAO data from the Motions is available for download in ZIP format:
- 2024-06-30-walking-motion.zip - Motions @ 1 Hz and 5 Hz
Observations
Cycling
The image below shows how speed (red) does not appear to be filtered / smoothed, and exhibits the type of aliasing that is often observed in unfiltered speeds from 1 Hz devices (re: Nyquist).

A comparison of 5 Hz Motion data (red), 1 Hz Motion data (blue) and 1 Hz Garmin data (green) shows the 1 Hz sampling artefacts (re: Nyquist theorem).

Other
The image below shows how speed (red) does not appear to be filtered / smoothed, and exhibits the type of aliasing that is often observed in unfiltered speeds from 1 Hz devices (re: Nyquist).
Note: Several data points did not update latitude + longitude, giving the impression of spikes in GPSResults.

A comparison of 5 Hz Motion data (red), 1 Hz Motion data (blue) and 1 Hz Garmin data (green) shows the 1 Hz sampling artefacts (re: Nyquist theorem).

Cycling
This interval is quite interesting because it is not behaving like the first cycling activity. This has similarities with the filtering seen in the cycling data from 2024-06-25. It appears that the filtering applied during a cycling activity can actually vary.

A comparison of 5 Hz Motion data (red), 1 Hz Motion data (blue) and 1 Hz Garmin data (green) shows just how different this cycling data is to the 1 Hz Motion data, quite unlike the cycling data at the start of this test.

Other
The image below shows how speed (red) does not appear to be filtered / smoothed, and exhibits the type of aliasing that is often observed in unfiltered speeds from 1 Hz devices (re: Nyquist).

A comparison of 5 Hz Motion data (red), 1 Hz Motion data (blue) and 1 Hz Garmin data (green) shows the 1 Hz sampling artefacts (re: Nyquist theorem).

Comparison
Comparison of the speeds for Cycling (red), Other (green), Cycling (magenta), Other (yellow) vs 5 Hz Motion (blue):

Notes:
- The filtering seen during the second cycling test (magenta) is quite unlike the first test.
- It would appear that the filtering for cycling can change quite substantially!
- It is interesting to contrast this data with that of the COROS APEX 2 Pro, since it uses the same Airoha AG3335M chipset.
- The APEX 2 Pro results for these test sessions can be found on a separate page.
Summary
Cycling
- The filtering seen during the second cycling test (magenta) is quite unlike the first test.
- It would appear that the filtering for cycling can change quite substantially!
Other
- Speed does not appear to be filtered / smoothed, and exhibits the type of aliasing that is often observed in unfiltered speeds from 1 Hz devices (re: Nyquist).
- Positional data is not dissimilar to running / hiking / cycling in previous tests.