gps-details
Garmin Activity Testing
Author: Michael George
Created: 9 July 2024
Overview
This page documents activity testing that was performed on 2024-06-25, whilst walking in an open-sky environment.
- Session 1 - Forerunner 255
- Cycling
- Stand Up Paddling
- Windsurfing
- Other
- Session 2 - Forerunner 255
- Running
- Trail Running
- Hiking
- Walking
These tests were more structured than the earlier test in May 2024.
1 Hz and 5 Hz data was also collected using Motion Minis.
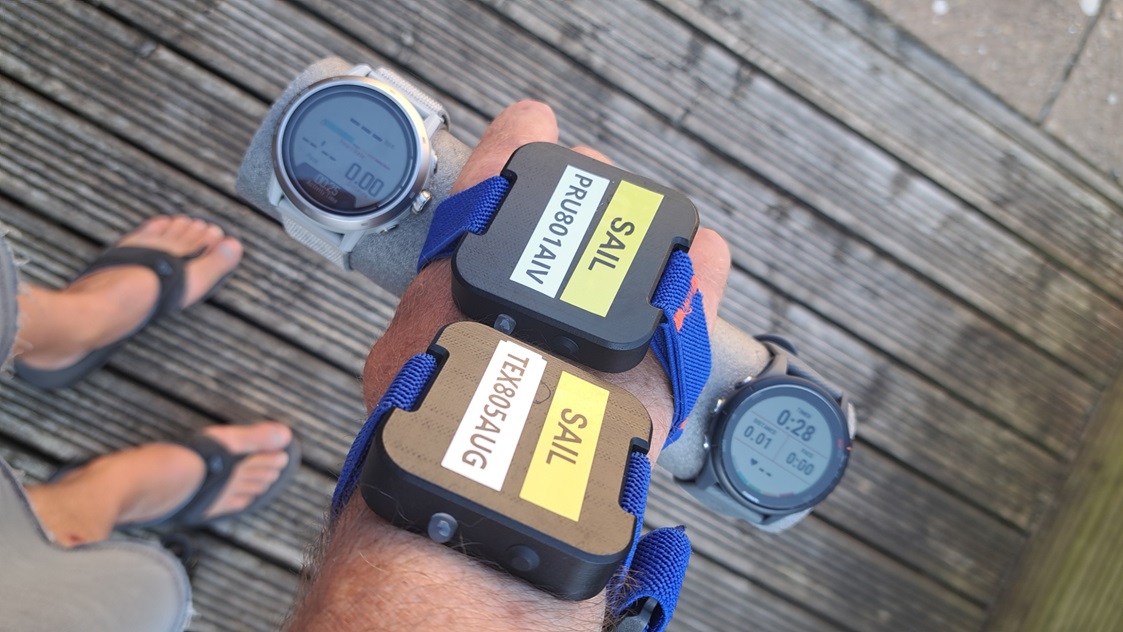
The devices were carried as shown in this photograph, including a COROS APEX 2 Pro on the left:
Data
All of the FIT data is available for download in ZIP format:
- 2024-06-25-walking-fr-255.zip - Forerunner 255
The OAO data from the Motions is available for download in ZIP format:
- 2024-06-25-walking-motion.zip - Motions @ 1 Hz and 5 Hz
Session 1
Cycling
The image below shows how speed (red) does not appear to be filtered / smoothed, and exhibits the type of aliasing that is often observed in unfiltered speeds from 1 Hz devices (re: Nyquist).
Note: The first half of this data is rather noisy, but the reason for this is not understood. It is conceivable that the filtering applied to cycling activities may change during a session, depending on certain factors.

A comparison of 5 Hz Motion data (red), 1 Hz Motion data (blue) and 1 Hz Garmin data (green) shows the 1 Hz sampling artefacts (re: Nyquist theorem).

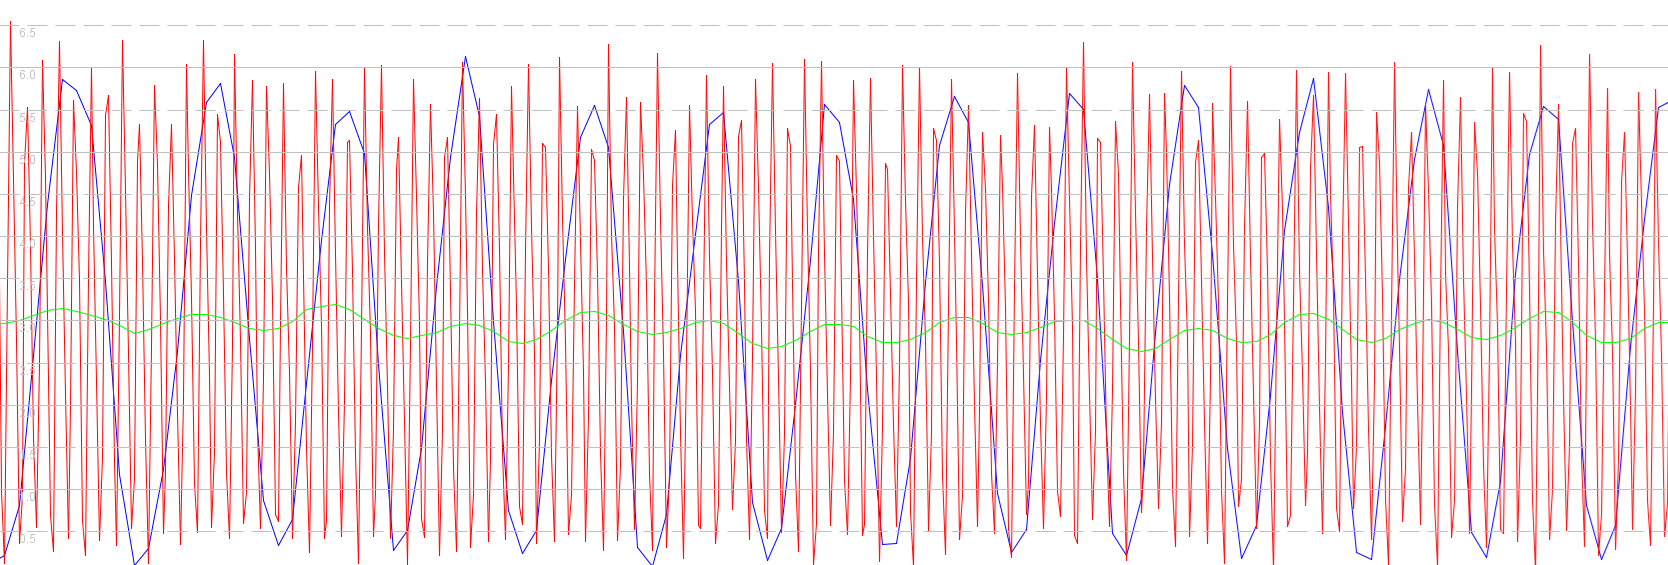
Stand Up Paddling
The image below shows how speed (red) is heavily filtered / smoothed, and exhibits the type of aliasing that is often observed in unfiltered speeds from 1 Hz devices (re: Nyquist). This behavior is very different to the Flatwater mode of COROS watch which behave like cycling, windsurfing, etc.
Note: One data point in the middle did not update latitude + longitude, giving the impression of a spike in GPSResults.

A comparison of 5 Hz Motion data (red), 1 Hz Motion data (blue) and 1 Hz Garmin data (green) shows the 1 Hz sampling artefacts (re: Nyquist theorem).
Windsurfing
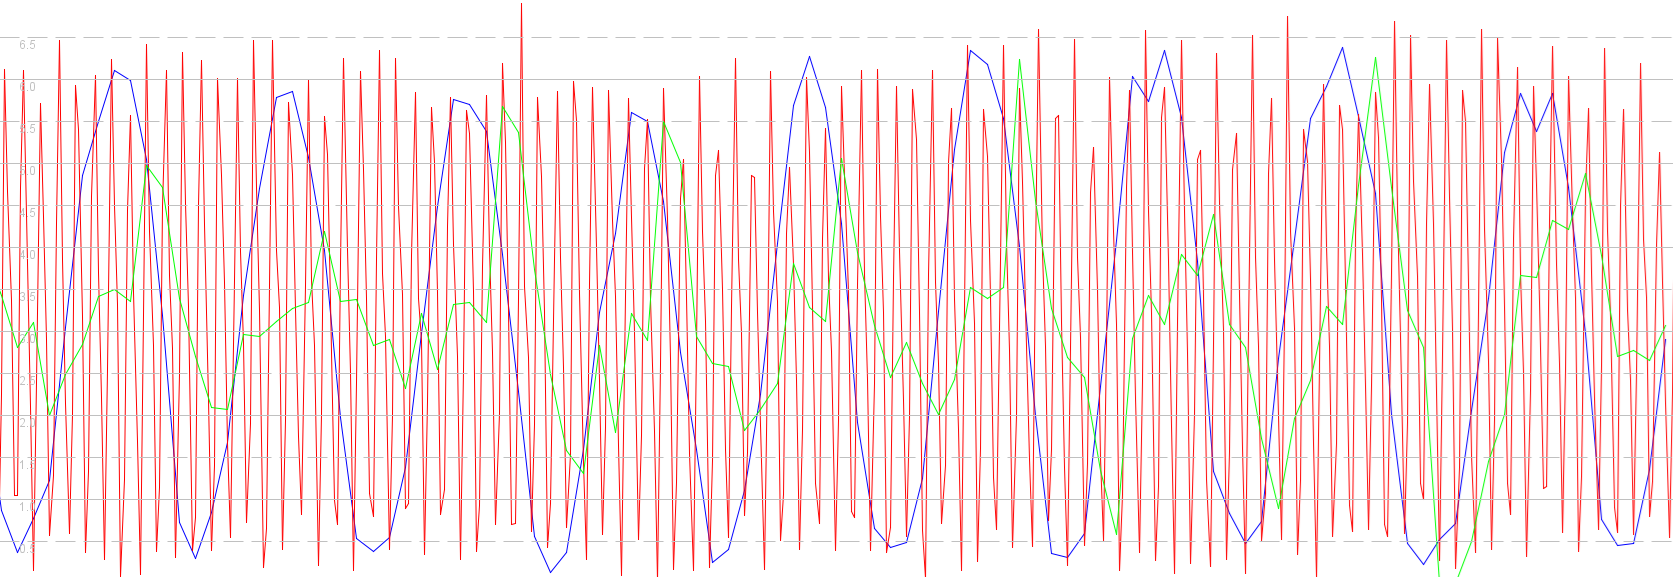
The image below shows how speed (red) does not appear to be filtered / smoothed, and slightly exhibits the type of aliasing that is often observed in unfiltered speeds from 1 Hz devices (re: Nyquist).
Note: An early data point did not update latitude + longitude, giving the impression of a spike in GPSResults.

A comparison of 5 Hz Motion data (red), 1 Hz Motion data (blue) and 1 Hz Garmin data (green) shows the 1 Hz sampling artefacts (re: Nyquist theorem).
Other
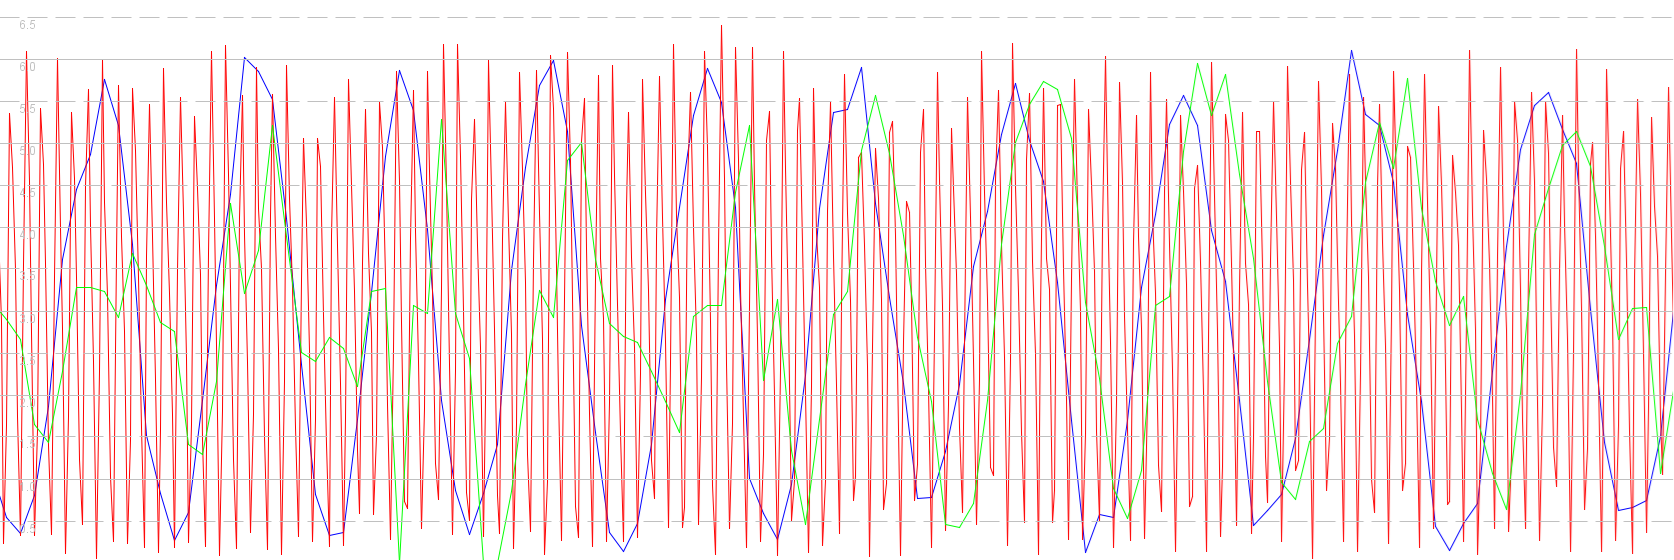
The image below shows how speed (red) does not appear to be filtered / smoothed, and exhibits the type of aliasing that is often observed in unfiltered speeds from 1 Hz devices (re: Nyquist).

A comparison of 5 Hz Motion data (red), 1 Hz Motion data (blue) and 1 Hz Garmin data (green) shows the 1 Hz sampling artefacts (re: Nyquist theorem).
Session 2
Running
The image below shows how speed (red) is heavily filtered / smoothed. Positional data (green) is relatively noisy, and possibly closer to the raw GNSS data (unlike COROS).

Trail Running
The image below shows how speed (red) is heavily filtered / smoothed. Positional data (green) is relatively noisy, and possibly closer to the raw GNSS data (unlike COROS).
Note: There is only a few minutes worth of trail running data due to not starting the recording correctly. It takes almost 2 minutes for the filtering to settle down to something resembling the other tests.

Hiking
The image below shows how speed (red) is heavily filtered / smoothed. Positional data (green) is relatively noisy, and possibly closer to the raw GNSS data (unlike COROS).

Walking
The image below shows how speed (red) is heavily filtered / smoothed. Positional data (green) is relatively noisy, and possibly closer to the raw GNSS data (unlike COROS).

Comparison
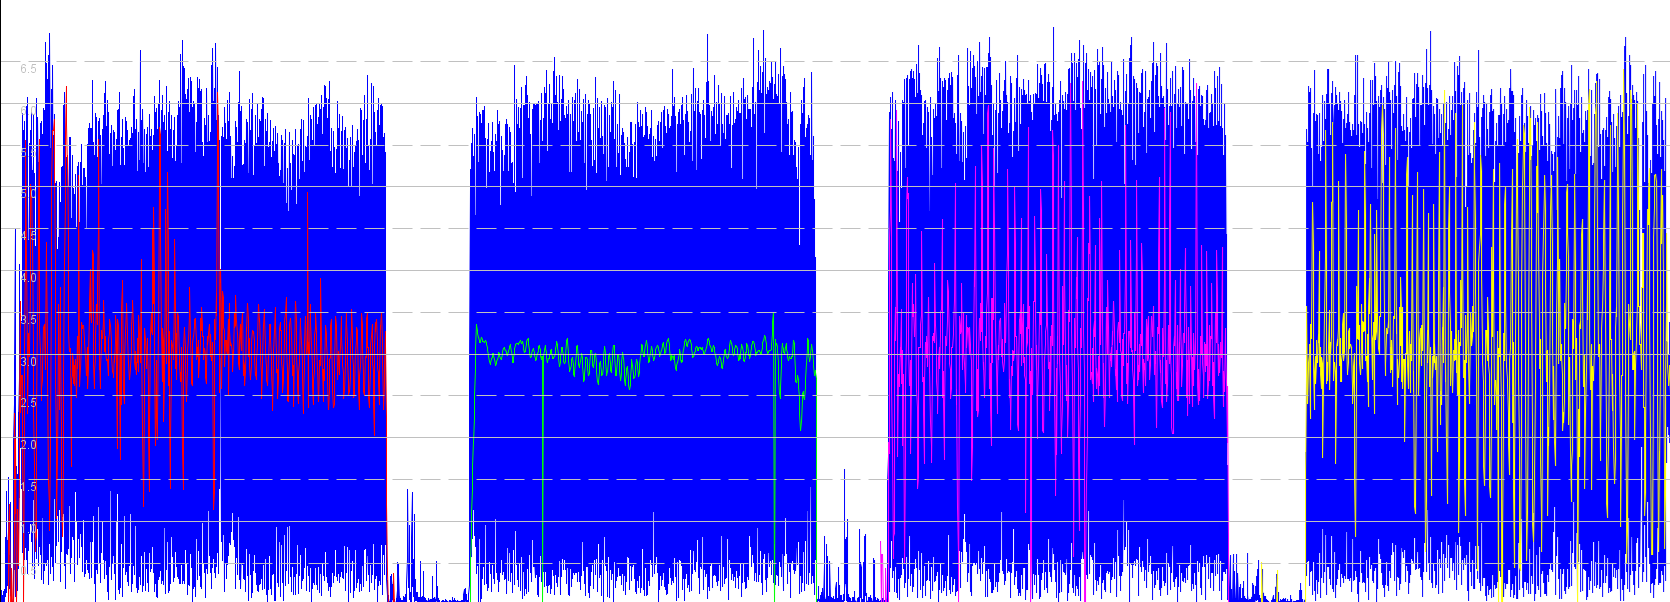
Comparison of the speeds for Cycling (red), Stand Up Paddling (green), Windsurfing (magenta), Other (yellow) vs 5 Hz Motion (blue):
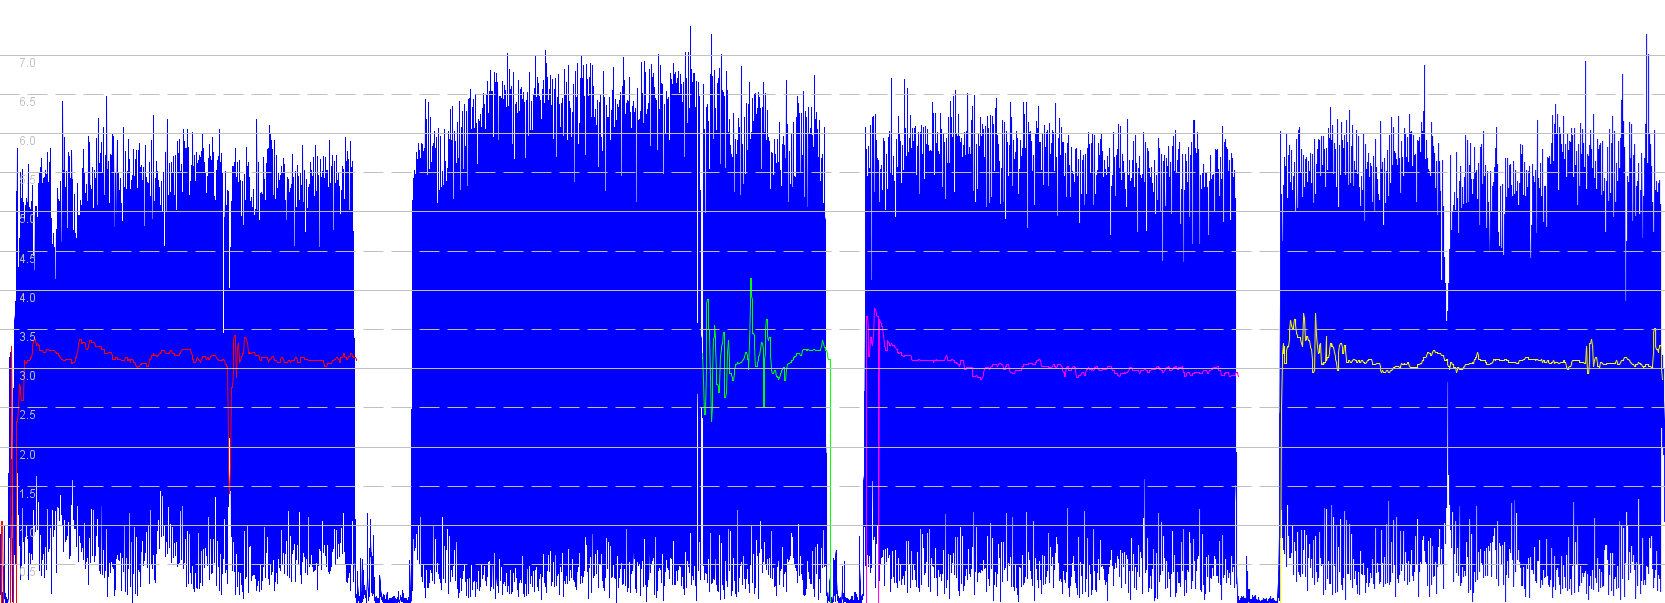
Comparison of the speeds for Running (red), Trail Running (green), Hiking (magenta), Walking (yellow) vs 5 Hz Motion (blue):
Notes:
- The hiking data is incomplete due to failing to start the recording properly.
- The majority of the hiking data is the time taken for the filtering to settle down.
- The two graphs above show two distinct types of filtering / smoothing:
- Cycling / Windsurfing / Other are the closest to the raw GNSS speeds, certainly closer than the COROS.
- Stand Up Paddling is clearly applying quite heavy filtering / smoothing the speed data, unlike the COROS.
- Running / Trail Running / Hiking / Walking apply the most aggressive levels of filtering / smoothing.
- It is interesting to contrast this data with that of the COROS APEX 2 Pro, since it uses the same Airoha AG3335M chipset.
- The APEX 2 Pro results for these test sessions can be found on a separate page.
Summary
Running / Trail Running / Hiking / Walking
- Speed is heavily filtered / smoothed.
- Positional data is relatively noisy, and possibly closer to the raw GNSS data (unlike COROS).
Stand Up Paddling
- Speed is heavily filtered / smoothed, but not as much as running / hiking / walking.
- Speed and positional data exhibits the type of aliasing that is often observed in unfiltered speeds from 1 Hz devices (re: Nyquist).
Cycling / Windsurfing / Other
- Speed does not appear to be filtered / smoothed, and exhibits the type of aliasing that is often observed in unfiltered speeds from 1 Hz devices (re: Nyquist).
- Positional data is not dissimilar to running, hiking, or cycling.