covid-stats
Weekly Deaths in England and Wales
Estimating Regional Deaths by Date of Occurrence
Author: Michael George
Created: 1 February 2021
Updated: 31 March 2021
Introduction
The Office for National Statistics (ONS) release provisional figures for weekly death registrations, every Tuesday morning at around 9.30am. These figures include deaths that have been registered up until the Friday 11 days prior to the publication.
e.g. The weekly publication on Tue 26th Jan 2021 included deaths registered up to Fri 15th Jan 2021.
Historically these publications have only included weekly registrations but since 2020 they have also included other data such as deaths relating to COVID-19. The additional data is available both daily + weekly and by registration date + occurrence date.
Registration Delays
There is always a delay between when a death occurs and when it is registered with the General Register Office (GRO), prior to details being sent to the ONS. This “registration delay” is typically about 4-5 days on average and slightly less for COVID-19 deaths, which are registered within 3-4 days on average.
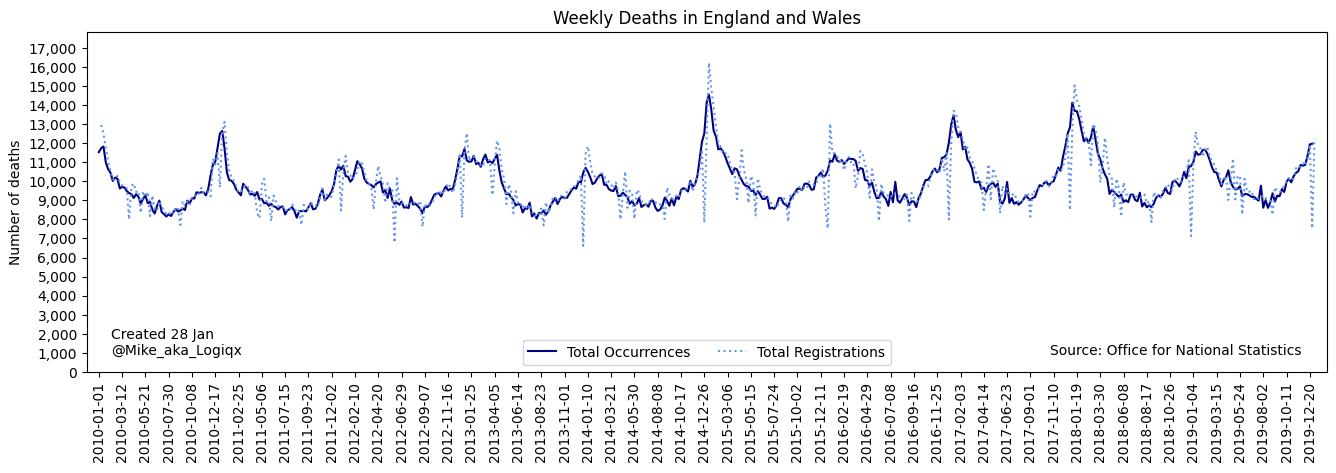
There are significant dips and spikes in registrations around the weeks containing bank holidays, which can be seen when analysing historical data. The chart below clearly shows the impact of bank holidays on death registrations (dotted line) when compared to the dates of the actual occurrences (solid line).
This makes interpretation of weekly registration data somewhat tricky, especially around Christmas + New Year, Easter, etc.
Date of Occurrence
Within the weekly deaths report there are a number of additional sheets detailing deaths that are related to COVID-19. The additional data is available both daily + weekly and by registration date + occurrence date. All of this additional data is provided for the 9 regions of England and Wales.
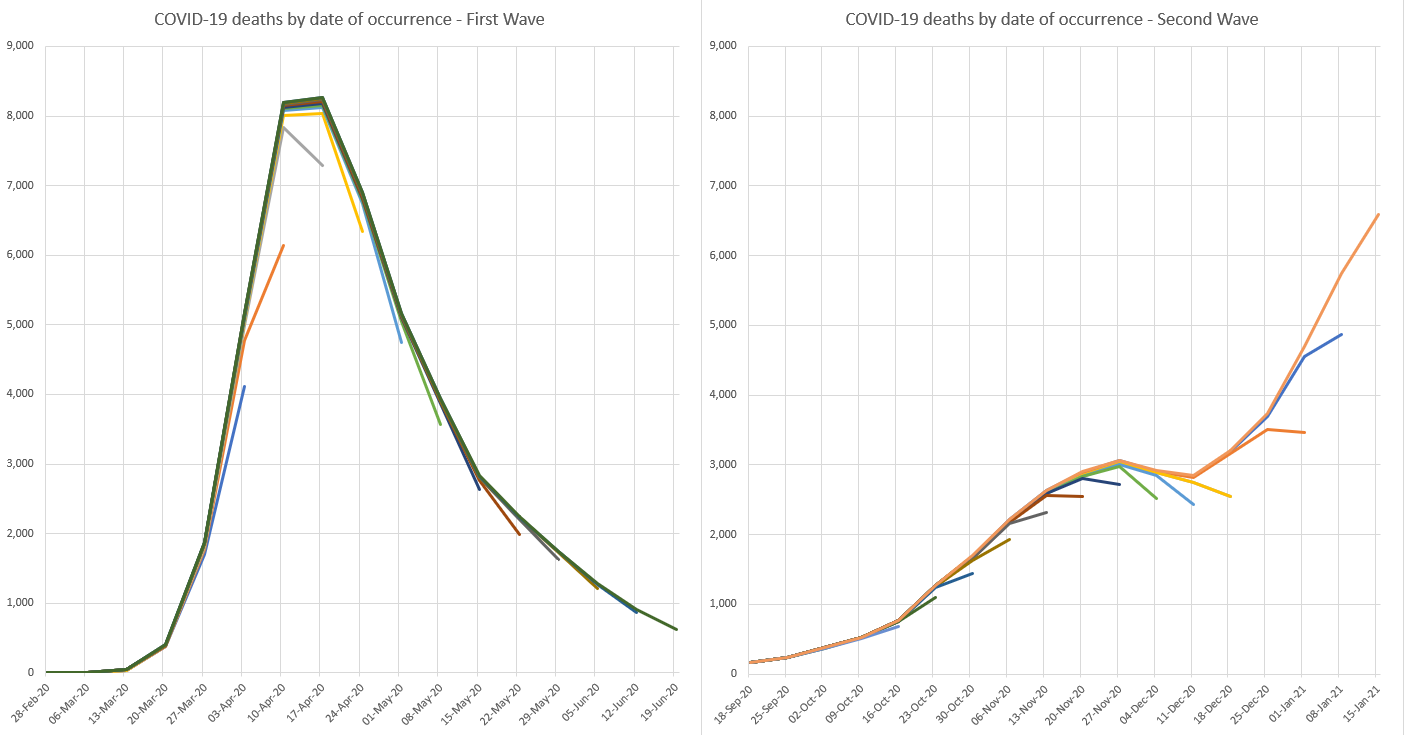
The date of “occurrence” (date of death) makes for much clearer analysis but it must be understood that the latest week will always be incomplete. This can be seen by overlaying the weekly COVID-19 deaths from all of the reports by date of occurrence. It can clearly be seen that the first time a week is published it is somewhat incomplete but by the following week it is pretty much up to date.
The exceptions to this general rule are where there are multiple bank holidays close together in which case the “catch up” may take a couple of weeks; see weeks ending 25 Dec 2020 and early 1 Jan 2021.
Estimating Date of Occurrence
Since the COVID-19 deaths are available by date of occurrence, it would be highly desirable to show weekly deaths by region for all other causes of death. The ONS have devised a methodology to estimate the total number of deaths occurring based on the limited registration data available. I also did something similar back in May 2020, albeit somewhat simpler but slightly before the ONS published their own methodology.
Since the middle of 2020 the ONS have provided estimates for weekly deaths based on the date of occurrences. Using this ONS data, I have devised a simple method to approximate the regional occurrences and this will be explained throughout the remainder of this document. This allows charts to be produced for each region which are highly representative of deaths by date of occurrence.
Evaluation of the Estimations
Prior to explaining the methodology itself, I will quickly summarise its effectiveness.
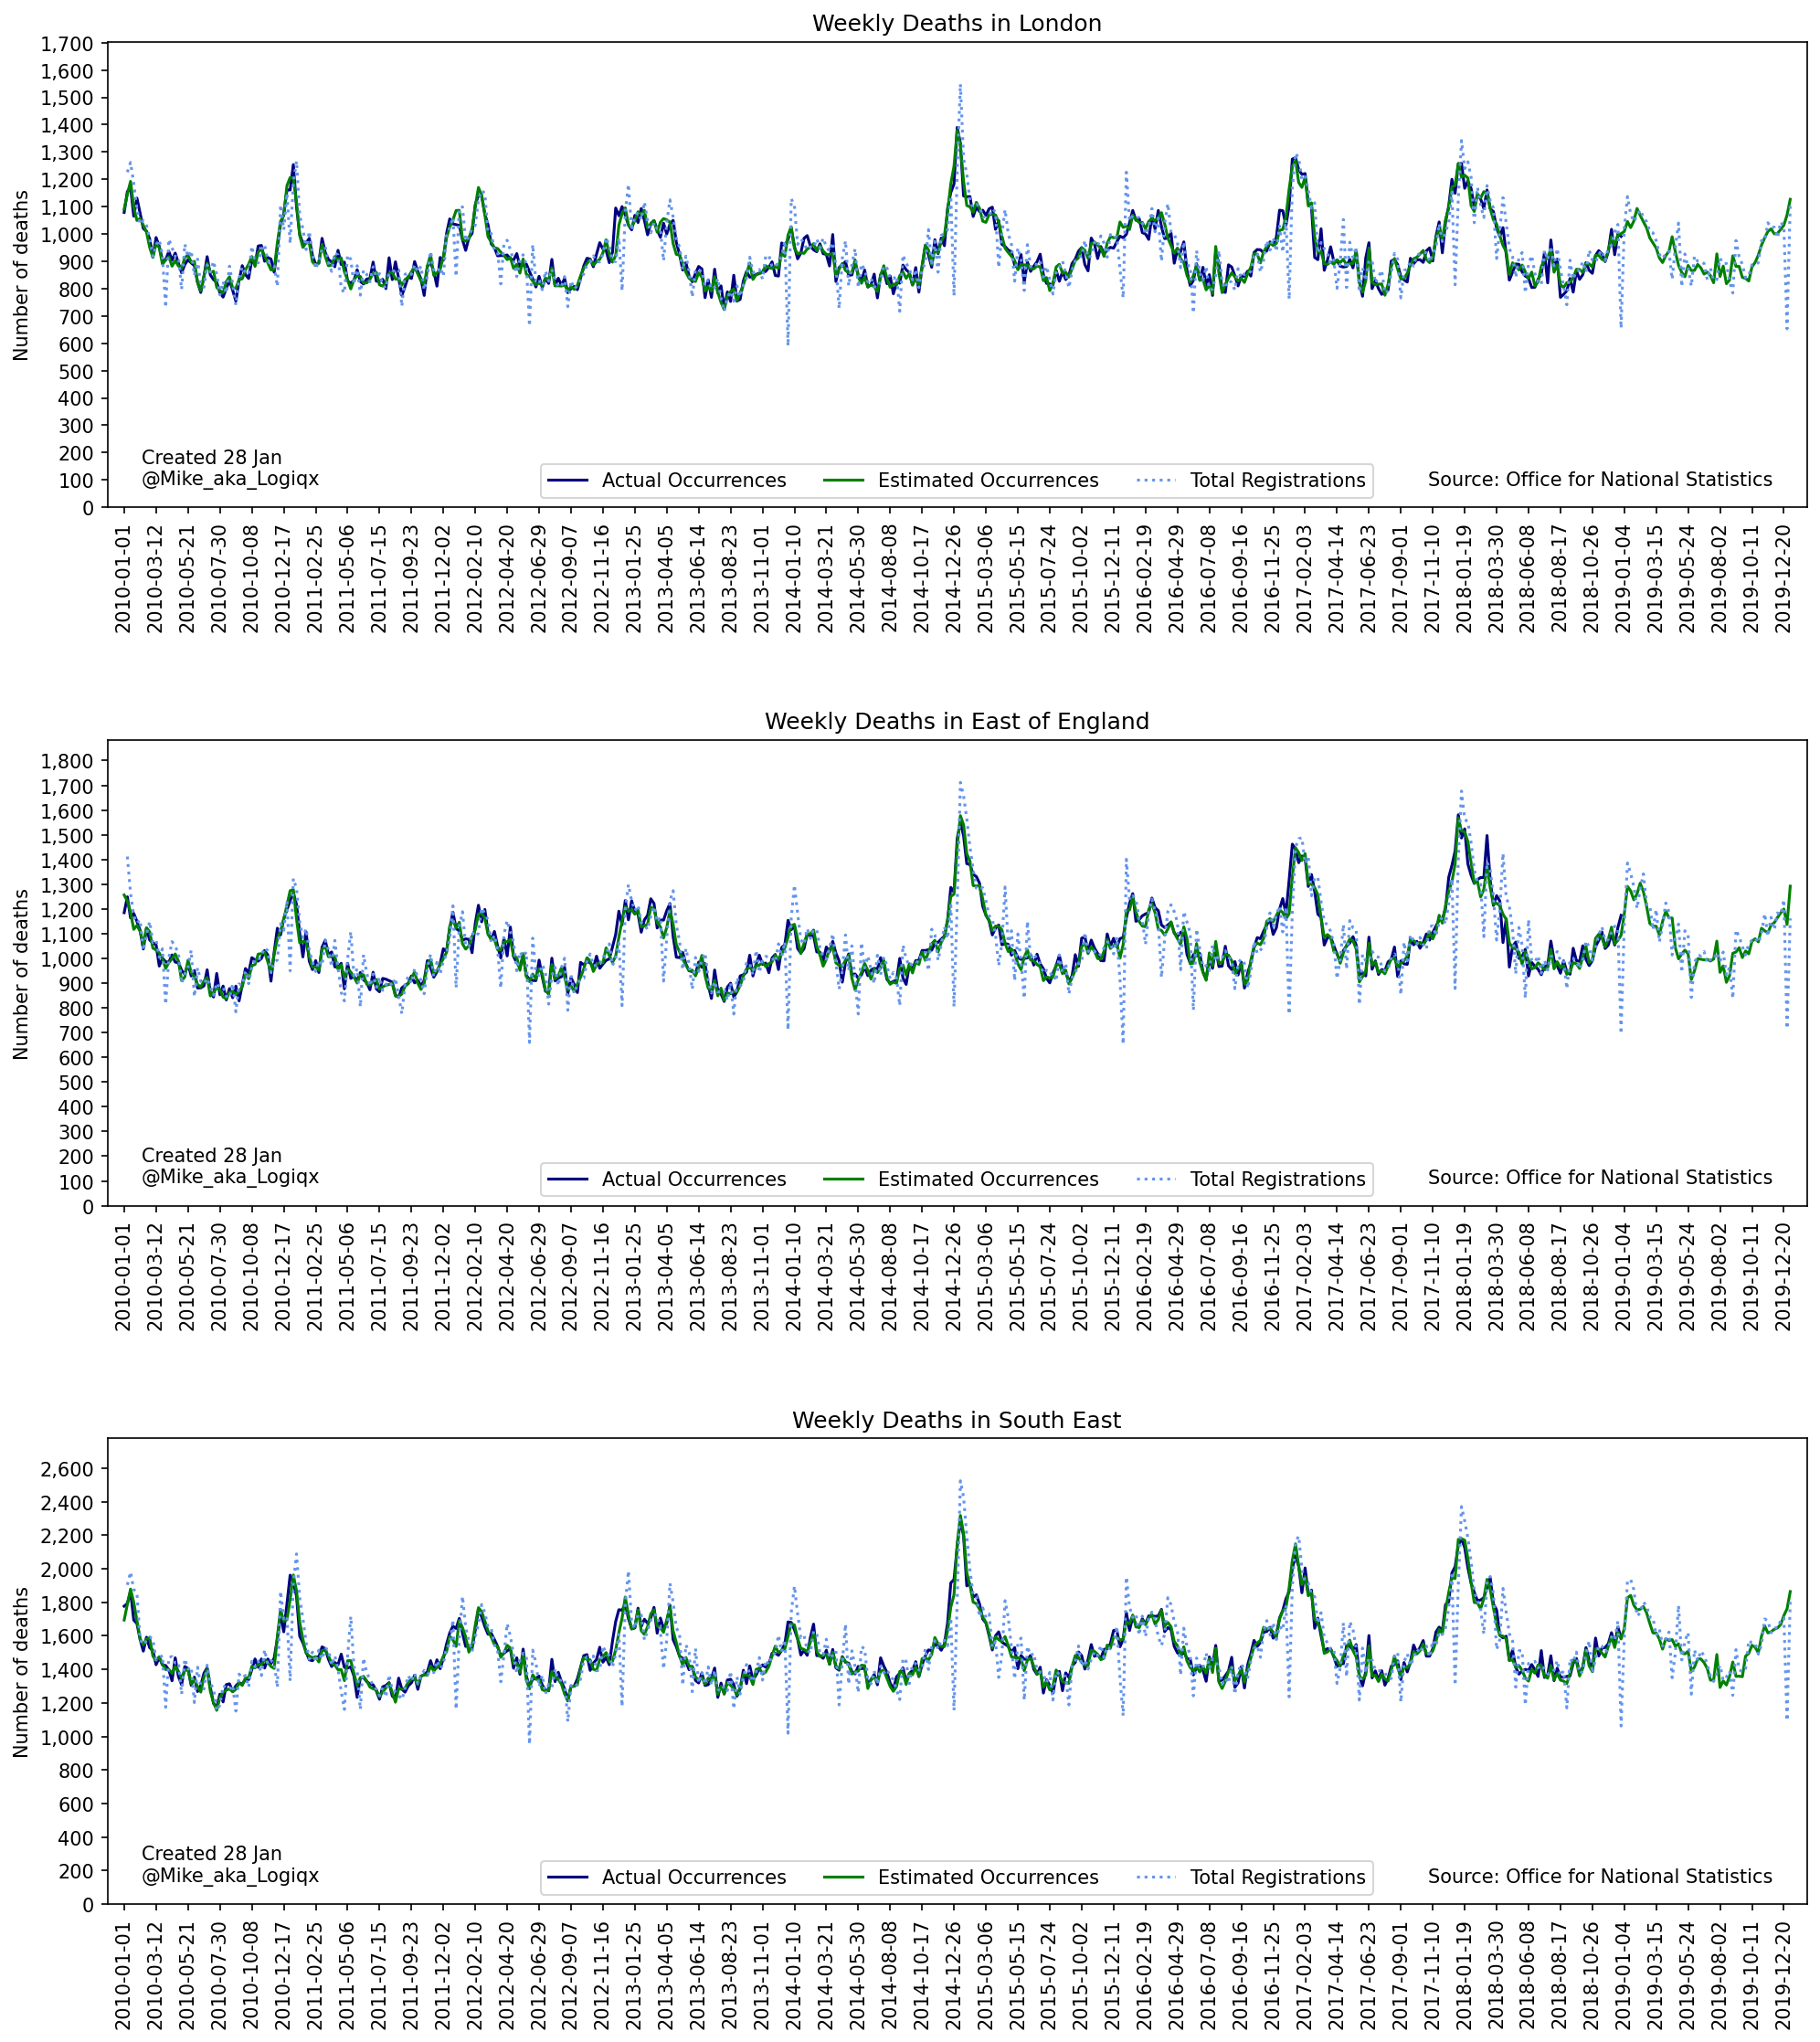
The 3 charts below show 10 years worth of historical data and illustrate how well the methodology can estimate weekly occurrences. It can clearly be seen that the estimates (green line) are highly representative of the actuals (blue line).
The mean absolute error (MAE) of the estimates is close to 2.3% for most regions of England when tested against the historical data for 2010 to 2018. This is much better than weekly registrations which have an MAE of around 5.5% and significant errors affecting weeks before and after bank holidays (dotted blue line).
Methodology
Since creating my original charts, I have refined the estimation method such that data for 2020 and 2021 uses death registrations and occurrences by local authority and health board from the ONS.
For the year 2019, I still use the following approach to estimate weekly occurrences for each region:
1) Closely align the weekly registrations with the weekly occurrences for each region of England and Wales as follows:
Shift the weekly registrations left by ~3.5 days, using a simple moving average so (current week + next week) / 2.
2) Estimate the weekly occurrences for each region of England and Wales as follows:
estimated occurrences = (shifted regional registrations / shifted national registrations) * national occurrences
For the years 2020 onwards, I have used the following approach to estimate weekly occurrences for each region:
1) Roll up the local authority data to regional level; deaths by date of occurrence.
2) Calculate the weekly ratios for estimated occurrences (England + Wales) vs known registrations (England and Wales).
2) Estimate the weekly occurrences for each region of England and Wales as follows:
estimated occurrences = known occurrences * weekly ratio
Results
Historical data prior to 31 Dec 2018 bypasses the estimation process because regional deaths by date of occurrence are readily available on the ONS website.
It is only the deaths after 1 Jan 2019 which require the estimation process and as detailed earlier the result has proven to be very accurate when tested using historical data; MAE of ~2.3%. Whilst this approach could be refined by considering the more complex aspects of registration delays and knowledge of bank holidays it is more than adequate for simple charts showing weekly deaths.
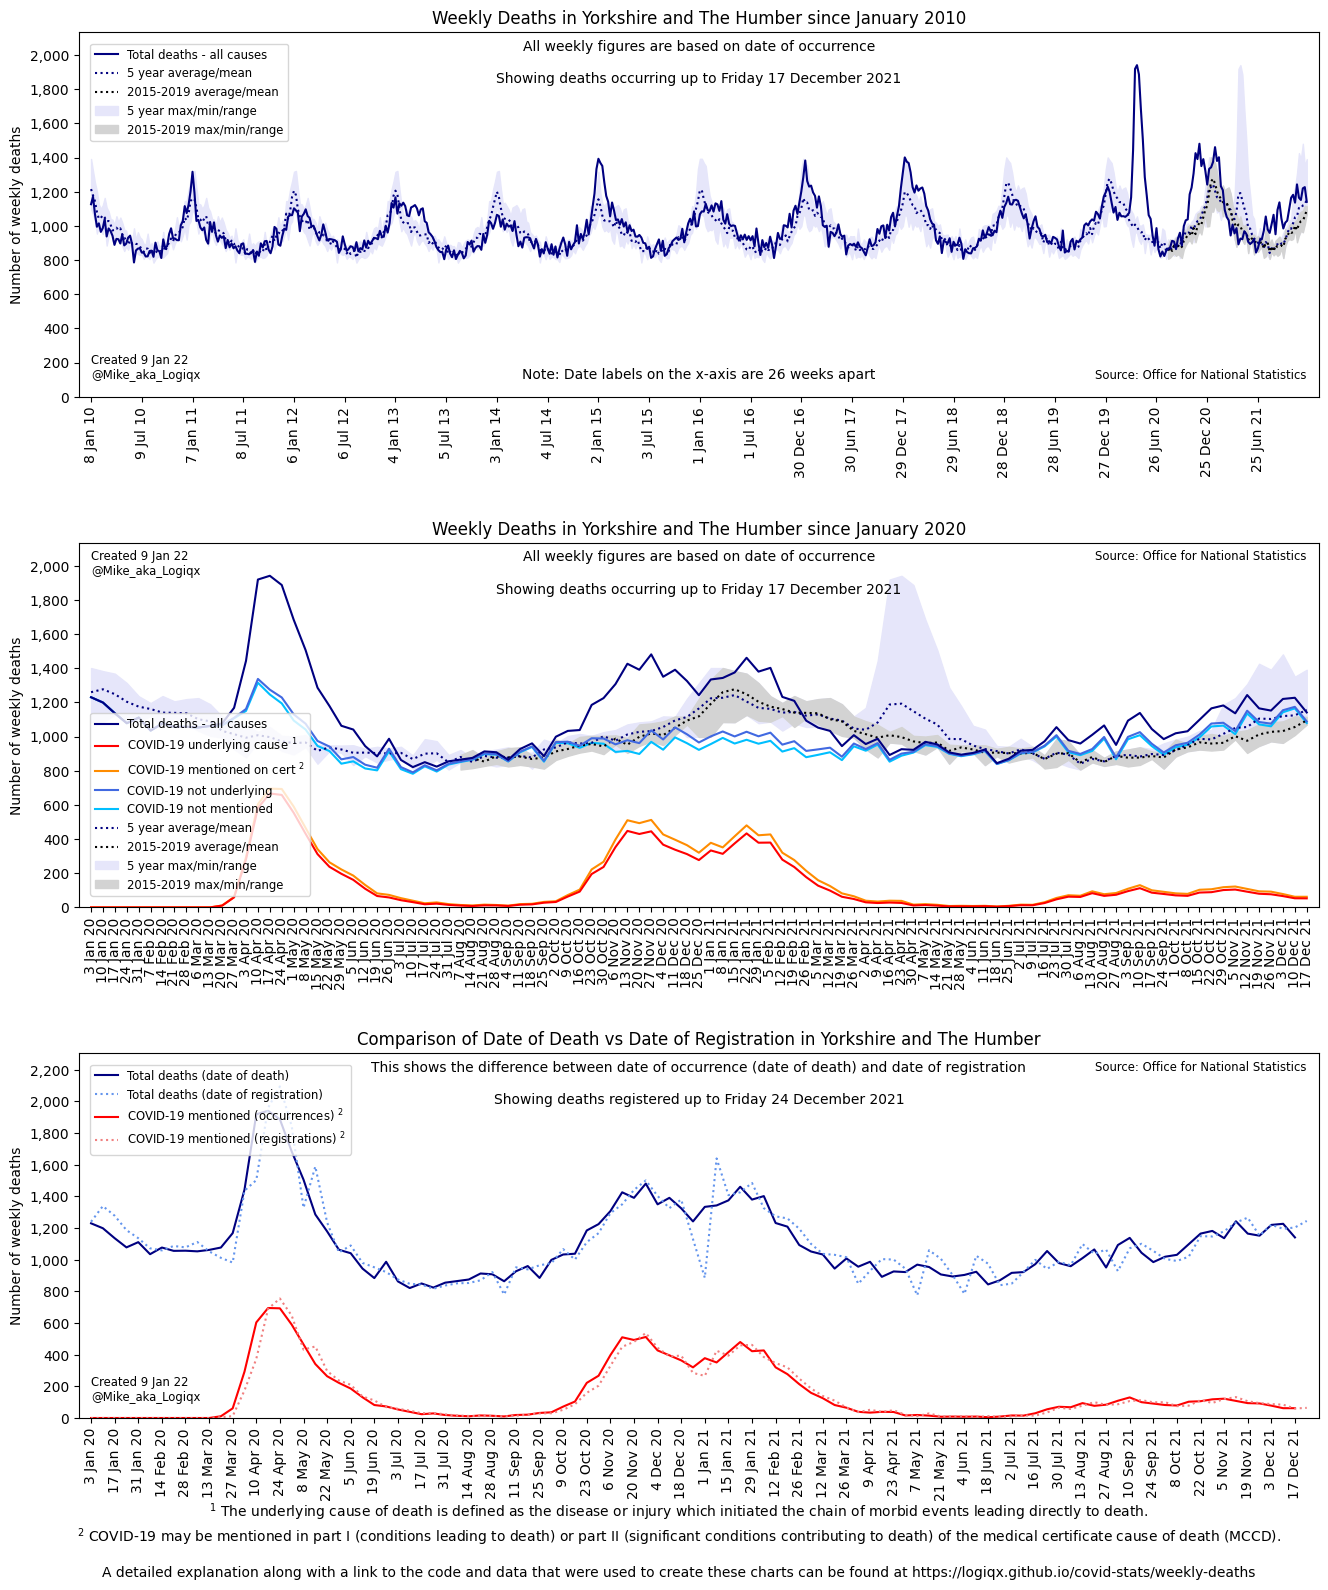
The results of estimating regional occurrences for 1 Jan 2019 onwards have been used to produce a variety of charts, which have been published on Github Pages and Twitter.
Data Sources
To produce the charts shown above it has been necessary to source historical data as well as recent data from the ONS.
Historical Data
Daily data for the 9 regions of England and Wales (up to 31 Dec 2018) is available in two user data requests:
- Daily deaths, English regions and Wales, 2015 to 2018 occurrences
- Daily death occurrences, England, regions of England and Wales: 1970 to 2014
Daily data for England and Wales (1 Jan 2019 to 31 Jul 2020) is available in the Excess Winter Mortality (EWM) bulletins:
- Daily Deaths for England and Wales 2018/2019
- Daily Deaths for England and Wales 2019/2020, needs to be re-combined with daily COVID-19 deaths by date of occurrence
I have submitted a request to the ONS for deaths by date of occurrence up to 31 Dec 2019, across all 9 regions of England and Wales.
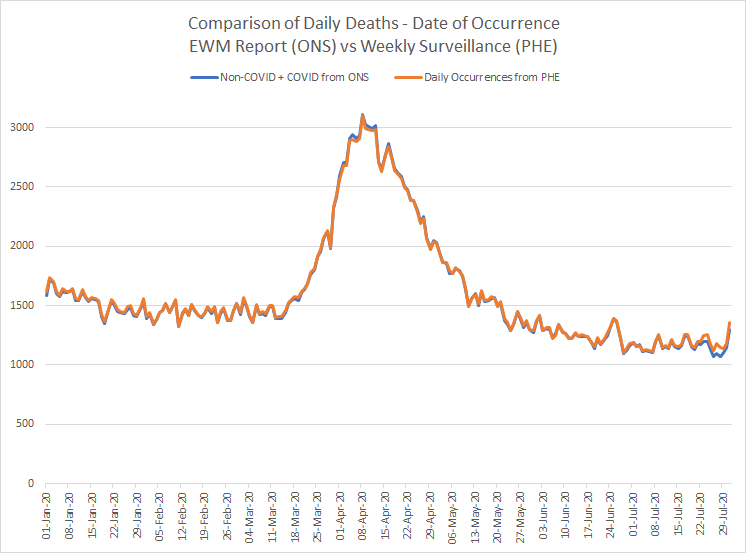
Sanity Check
The provisional 2020 data for England in the EWM bulletin was combined with daily COVID-19 deaths and compared to the daily surveillance data from Public Health England (PHE). This simple comparison showed that the EWM figures are closely aligned with the daily estimates from PHE and thus perfectly suitable for this activity.
Latest Data
Weekly registrations for 2019 onwards are in the weekly dataset published by the ONS.
Estimated weekly occurrences for August 2020 onwards have also been taken from the weekly dataset from the ONS.
Known weekly occurrences for Jan 2020 onwards are taken from the weekly dateset for local authorities from the ONS.
Python scripts have been written to download the latest data from the ONS website and convert it into CSV format.
Choice of Occurrence Data
It is necessary to source either daily or weekly occurrence data from Aug 2020 onwards.
There are two options at this time:
- The weekly estimates of deaths by date of occurrence from the ONS which are included in their weekly deaths dataset.
- The daily deaths data from PHE which has been adjusted to account for registration delays.
A brief description of each source will be given below and reasoning behind the most suitable choice.
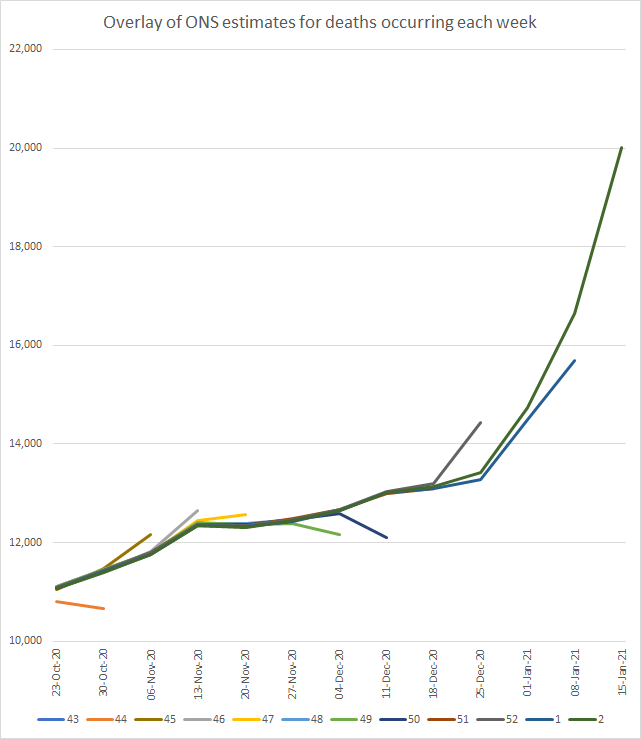
Weekly Estimate from the ONS
The ONS provide an estimate for weekly occurrences in England and Wales and they have documented their methodology.
Overlaying all of the historical estimates it is possible to see that the latest week shows some degree of inaccuracy. This is akin to what is observed when overlaying COVID-19 deaths by date of occurrence from the weekly reports. The estimation of weekly occurrences automatically corrects itself the following week in much the same way that occurrence data corrects itself when the late registrations are received by the ONS.
Analysis of the accuracy of the ONS estimates for 2020 has shown that this could be a reliable source for recent deaths in England and Wales by date of occurrence. It is just important to ignore the latest weekly estimate and thus reporting by date of occurrence will lag one week behind the available registration data.
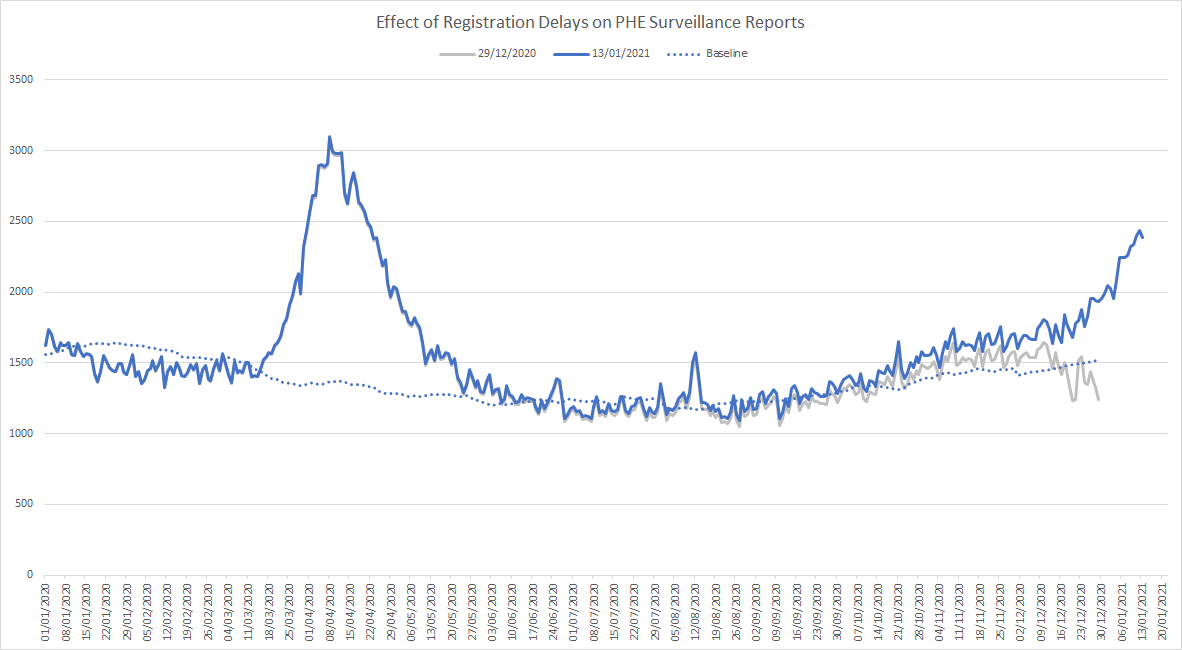
Daily Occurrences from PHE
The national flu and COVID-19 surveillance reports from PHE also contain daily deaths by date of occurrence, derived from registration data from the GRO but adjusting for the usual registration delays. Whilst this data is only available for England it would still be possible to estimate regional occurrences using the algorithm described earlier.
Observations over recent weeks have shown that the PHE data can be subject to much greater reporting lags than one might expect. The chart below shows how the daily estimates for Dec 2020 changed significantly between the surveillance report published on 29 Dec 2020 and 13 Jan 2021. Due to these unpredictable delays in the PHE data my own processing uses the ONS estimate of weekly deaths in England and Wales by date of occurrence.
Project Code and Data
All of the project code and associated data is available in a Python project on GitHub, amongst various other scripts and pieces of ad-hoc analysis relating to COVID-19 data.
These are the most significant Python scripts:
- ons_download.ipynb checks the ONS website for new weekly data and downloads the Excel spreadsheets.
- ons_lahb_deaths.ipynb combines the data from all of the local authority spreadsheets and saves them as CSV files.
- ons_convert.ipynb combines the data from all of the spreadsheets with historical extracts and saves them as CSV files.
- ons_charts.ipynb loads the CSV files into memory then calculates averages/maximums/minimums before plotting the charts.
A number of custom Python modules are also used which will become obvious when looking at the main scripts.
Summary
Data being used to determine weekly deaths by date of occurrence, across all 9 regions in England and Wales:
- All weekly figures up to 31 Dec 2018 are derived from daily occurrences, published by the ONS in the user data requests. This is already provided at a regional level so no estimation is required for these early years.
- 1 Jan 2019 to 31 Dec 2019 uses the daily occurrence data from EWM bulletins and daily COVID-19 occurrence data from the weekly ONS publications.
- 1 Jan 2020 onwards uses the estimated weekly occurrences for England and Wales from the weekly ONS publication. Deaths have been estimated at a regional level, using the weekly local authority data to establish national proportions.
I did submit a request to the ONS for deaths by date of occurrence up to 31 Dec 2019, across all 9 regions of England and Wales but due to a charge for the data, I decided to continue using the estimation method described in this document.
The results of estimating regional occurrences for 1 Jan 2019 onwards have been used to produce a variety of charts, which have been published on Github Pages and Twitter. The associated Python code and data can be found on GitHub, amongst various other scripts and pieces of ad-hoc analysis relating to COVID-19 data.